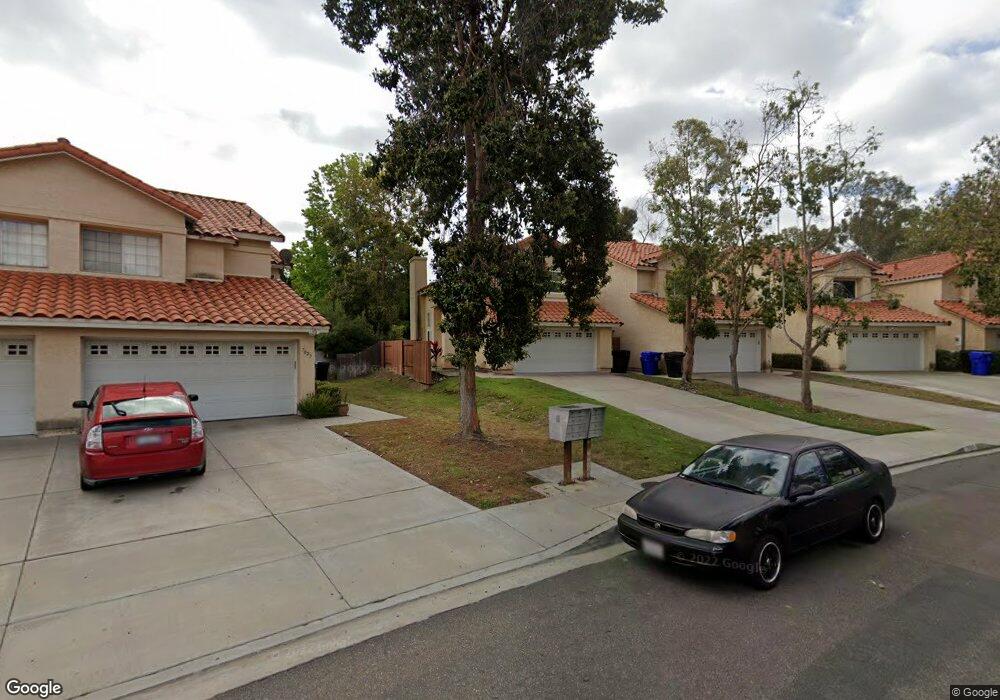
7017 Osler St San Diego, CA 92111
Linda Vista NeighborhoodEstimated Value: $973,136 - $1,073,000
3
Beds
3
Baths
1,551
Sq Ft
$668/Sq Ft
Est. Value
About This Home
This home is located at 7017 Osler St, San Diego, CA 92111 and is currently estimated at $1,036,534, approximately $668 per square foot. 7017 Osler St is a home located in San Diego County with nearby schools including Linda Vista Elementary School, Montgomery Middle School, and San Diego Cooperative Charter School.
Ownership History
Date
Name
Owned For
Owner Type
Purchase Details
Closed on
Jul 17, 2012
Sold by
Adams Rudo
Bought by
Devera Michelle M
Current Estimated Value
Home Financials for this Owner
Home Financials are based on the most recent Mortgage that was taken out on this home.
Original Mortgage
$311,200
Outstanding Balance
$214,613
Interest Rate
3.65%
Mortgage Type
New Conventional
Estimated Equity
$821,921
Purchase Details
Closed on
Sep 14, 2001
Sold by
Logan Jackie D
Bought by
Fratoni Albeert J and Metz Fratoni Jeannine
Home Financials for this Owner
Home Financials are based on the most recent Mortgage that was taken out on this home.
Original Mortgage
$264,800
Interest Rate
5.99%
Purchase Details
Closed on
May 8, 1998
Sold by
Logan Debra S
Bought by
Logan Jackie D
Home Financials for this Owner
Home Financials are based on the most recent Mortgage that was taken out on this home.
Original Mortgage
$160,000
Interest Rate
6.88%
Purchase Details
Closed on
Jun 29, 1988
Create a Home Valuation Report for This Property
The Home Valuation Report is an in-depth analysis detailing your home's value as well as a comparison with similar homes in the area
Home Values in the Area
Average Home Value in this Area
Purchase History
| Date | Buyer | Sale Price | Title Company |
|---|---|---|---|
| Devera Michelle M | -- | Fidelity National Title Co | |
| Devera Michelle M | $389,000 | Fidelity National Title Comp | |
| Fratoni Albeert J | $331,000 | Chicago Title Co | |
| Logan Jackie D | -- | Commonwealth Land Title Co | |
| -- | $153,000 | -- |
Source: Public Records
Mortgage History
| Date | Status | Borrower | Loan Amount |
|---|---|---|---|
| Open | Devera Michelle M | $311,200 | |
| Previous Owner | Fratoni Albeert J | $264,800 | |
| Previous Owner | Logan Jackie D | $160,000 | |
| Closed | Fratoni Albeert J | $66,200 |
Source: Public Records
Tax History Compared to Growth
Tax History
| Year | Tax Paid | Tax Assessment Tax Assessment Total Assessment is a certain percentage of the fair market value that is determined by local assessors to be the total taxable value of land and additions on the property. | Land | Improvement |
|---|---|---|---|---|
| 2025 | $5,752 | $479,009 | $289,437 | $189,572 |
| 2024 | $5,752 | $469,617 | $283,762 | $185,855 |
| 2023 | $5,624 | $460,410 | $278,199 | $182,211 |
| 2022 | $5,472 | $451,384 | $272,745 | $178,639 |
| 2021 | $5,429 | $442,535 | $267,398 | $175,137 |
| 2020 | $5,359 | $437,999 | $264,657 | $173,342 |
| 2019 | $5,260 | $429,412 | $259,468 | $169,944 |
| 2018 | $4,918 | $420,993 | $254,381 | $166,612 |
| 2017 | $4,800 | $412,740 | $249,394 | $163,346 |
| 2016 | $4,718 | $404,648 | $244,504 | $160,144 |
| 2015 | $4,648 | $398,571 | $240,832 | $157,739 |
| 2014 | $4,574 | $390,765 | $236,115 | $154,650 |
Source: Public Records
Map
Nearby Homes
- 2767 Lancha St
- 7016 Park Mesa Way
- 6929 Park Mesa Way Unit 126
- 2675 Comstock St
- 6728 Thomson Ct
- 6737 Thomson Ct
- 2818 Nye St
- 7128 E Hyatt St
- 2868-70 Preece St
- 2249-51 W Dunlop St
- 7462 Hanford Place
- 2525 Inman Ct
- 2290 Hanford Dr
- 2750 Wheatstone St Unit 153
- 2750 Wheatstone St Unit 110
- 2750 Wheatstone St Unit 113
- 2750 Wheatstone St Unit 105
- 2750 Wheatstone St Unit 64
- 2216-18 Dunlop St
- 3014 Old Bridgeport Way