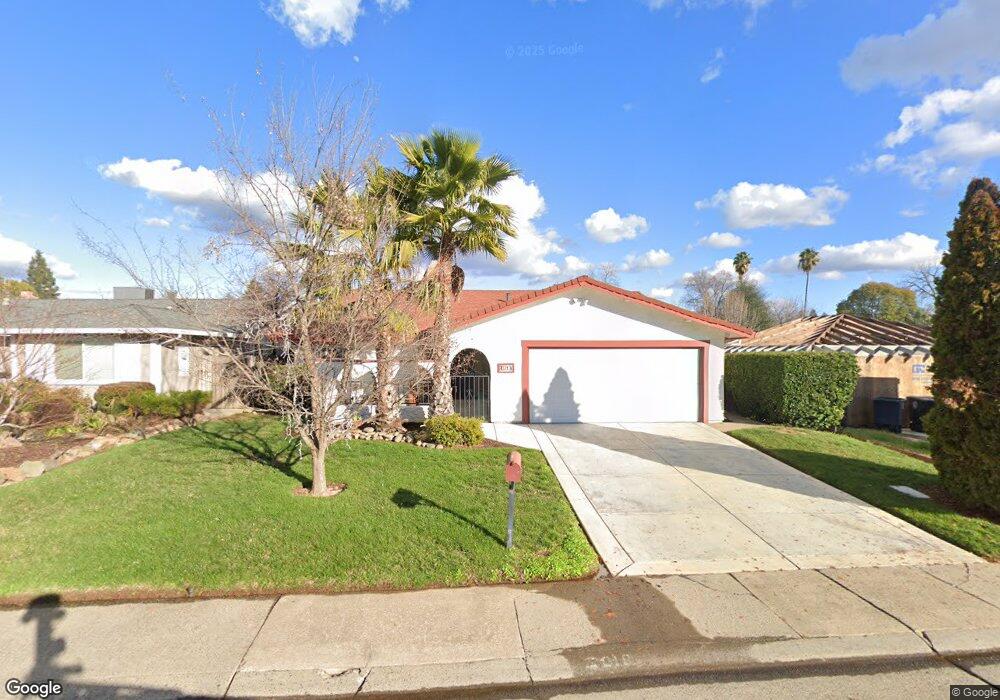
7018 Checkerbloom Way Citrus Heights, CA 95610
Estimated Value: $428,000 - $527,000
3
Beds
2
Baths
1,469
Sq Ft
$335/Sq Ft
Est. Value
About This Home
This home is located at 7018 Checkerbloom Way, Citrus Heights, CA 95610 and is currently estimated at $492,604, approximately $335 per square foot. 7018 Checkerbloom Way is a home located in Sacramento County with nearby schools including Trajan Elementary School, Louis Pasteur Fundamental Middle School, and Casa Roble Fundamental High School.
Ownership History
Date
Name
Owned For
Owner Type
Purchase Details
Closed on
Apr 22, 2004
Sold by
Reyes Romeo D
Bought by
Perea Marissa and Carrasco Joyce
Current Estimated Value
Home Financials for this Owner
Home Financials are based on the most recent Mortgage that was taken out on this home.
Original Mortgage
$230,400
Outstanding Balance
$101,502
Interest Rate
4.75%
Mortgage Type
Purchase Money Mortgage
Estimated Equity
$391,102
Purchase Details
Closed on
Jul 6, 2000
Sold by
Walsh Larry R and Walsh Gloria J
Bought by
Reyes Romeo D
Home Financials for this Owner
Home Financials are based on the most recent Mortgage that was taken out on this home.
Original Mortgage
$150,641
Interest Rate
8.55%
Mortgage Type
FHA
Create a Home Valuation Report for This Property
The Home Valuation Report is an in-depth analysis detailing your home's value as well as a comparison with similar homes in the area
Home Values in the Area
Average Home Value in this Area
Purchase History
| Date | Buyer | Sale Price | Title Company |
|---|---|---|---|
| Perea Marissa | $288,000 | Commonwealth Land Title Co | |
| Reyes Romeo D | $152,000 | Placer Title Company |
Source: Public Records
Mortgage History
| Date | Status | Borrower | Loan Amount |
|---|---|---|---|
| Open | Perea Marissa | $230,400 | |
| Previous Owner | Reyes Romeo D | $150,641 | |
| Closed | Perea Marissa | $14,400 |
Source: Public Records
Tax History Compared to Growth
Tax History
| Year | Tax Paid | Tax Assessment Tax Assessment Total Assessment is a certain percentage of the fair market value that is determined by local assessors to be the total taxable value of land and additions on the property. | Land | Improvement |
|---|---|---|---|---|
| 2025 | $4,759 | $409,455 | $106,623 | $302,832 |
| 2024 | $4,759 | $401,428 | $104,533 | $296,895 |
| 2023 | $4,637 | $393,558 | $102,484 | $291,074 |
| 2022 | $4,611 | $385,842 | $100,475 | $285,367 |
| 2021 | $4,533 | $378,277 | $98,505 | $279,772 |
| 2020 | $4,448 | $374,399 | $97,495 | $276,904 |
| 2019 | $4,091 | $344,911 | $89,815 | $255,096 |
| 2018 | $3,925 | $328,488 | $85,539 | $242,949 |
| 2017 | $3,565 | $295,936 | $77,063 | $218,873 |
| 2016 | $3,055 | $266,610 | $69,427 | $197,183 |
| 2015 | $2,819 | $246,862 | $64,285 | $182,577 |
| 2014 | $2,678 | $235,107 | $61,224 | $173,883 |
Source: Public Records
Map
Nearby Homes
- 7001 Checkerbloom Way
- 8057 Poulson St
- 8060 Hoopes Dr
- 8277 Rhodora Ct
- 7156 Melva St
- 7201 Canelo Hills Dr
- 7443 Heritage Meadow Place
- 7970 Larwin Dr
- 7412 Fox Hills Dr
- 8205 Lash Larue Ln
- 7517 Quail Vista Ln
- 8291 Central Ave
- 7135 Mathis Ct
- 7504 Wooddale Way
- 7963 Arcade Lake Ln
- 7977 Arcade Lake Ln Unit 81
- 8033 Arcade Lake Ln
- 7429 Tiara Way
- 6736 Wyatt Cir
- 6732 Wyatt Cir
- 7022 Checkerbloom Way
- 7014 Checkerbloom Way
- 7019 Forbs Way
- 7026 Checkerbloom Way
- 7010 Checkerbloom Way
- 7015 Forbs Way
- 7017 Checkerbloom Way
- 7027 Forbs Way
- 7021 Checkerbloom Way
- 7011 Forbs Way
- 7030 Checkerbloom Way
- 7013 Checkerbloom Way
- 7006 Checkerbloom Way
- 7025 Checkerbloom Way
- 7031 Forbs Way
- 7009 Checkerbloom Way
- 7007 Forbs Way
- 7034 Checkerbloom Way
- 7029 Checkerbloom Way
- 7035 Forbs Way