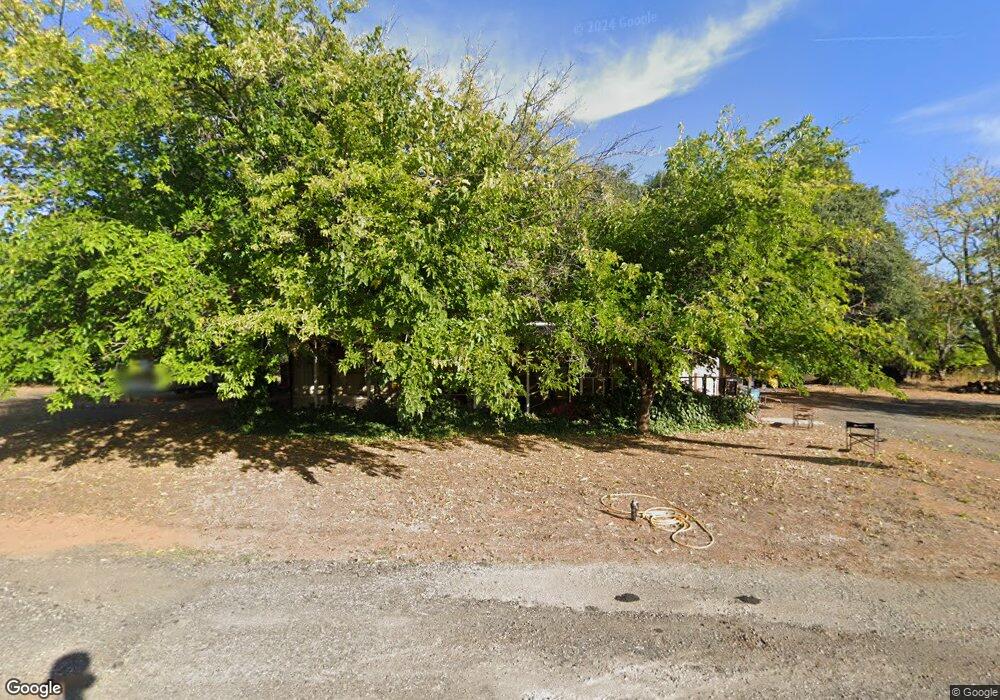
7019 Autumn Way Redding, CA 96002
2
Beds
2
Baths
1,140
Sq Ft
1.3
Acres
About This Home
This home is located at 7019 Autumn Way, Redding, CA 96002. 7019 Autumn Way is a home located in Shasta County with nearby schools including Prairie Elementary School, Pacheco Elementary School, and Northern Summit Academy.
Ownership History
Date
Name
Owned For
Owner Type
Purchase Details
Closed on
Nov 5, 2002
Sold by
Gutierrez Jackie Lee
Bought by
Muto Frank A and Muto Lisa A
Purchase Details
Closed on
Oct 17, 2002
Sold by
Standridge Malen E
Bought by
Muto Frank A and Muto Lisa A
Purchase Details
Closed on
Jul 10, 2002
Sold by
Bates Steve A
Bought by
Standridge Malen E
Purchase Details
Closed on
Mar 4, 2002
Sold by
Trinity Equity Funding
Bought by
Bates Steve A and Gutierrez Jackie L
Home Financials for this Owner
Home Financials are based on the most recent Mortgage that was taken out on this home.
Original Mortgage
$43,200
Interest Rate
6.94%
Mortgage Type
Seller Take Back
Purchase Details
Closed on
Oct 8, 2001
Sold by
Long Vernon D and Long Patricia R
Bought by
Trinity Equity Funding
Purchase Details
Closed on
Sep 18, 1997
Sold by
Snow Sidney and Snow Ketel Gloria M
Bought by
Long Vernon D and Long Patricia R
Home Financials for this Owner
Home Financials are based on the most recent Mortgage that was taken out on this home.
Original Mortgage
$56,500
Interest Rate
7.54%
Mortgage Type
Seller Take Back
Create a Home Valuation Report for This Property
The Home Valuation Report is an in-depth analysis detailing your home's value as well as a comparison with similar homes in the area
Home Values in the Area
Average Home Value in this Area
Purchase History
| Date | Buyer | Sale Price | Title Company |
|---|---|---|---|
| Muto Frank A | $7,000 | -- | |
| Muto Frank A | $3,000 | -- | |
| Standridge Malen E | -- | -- | |
| Bates Steve A | $40,500 | Placer Title Company | |
| Trinity Equity Funding | $56,590 | First American Title Co | |
| Long Vernon D | $53,500 | Chicago Title Co |
Source: Public Records
Mortgage History
| Date | Status | Borrower | Loan Amount |
|---|---|---|---|
| Previous Owner | Bates Steve A | $43,200 | |
| Previous Owner | Long Vernon D | $56,500 |
Source: Public Records
Tax History Compared to Growth
Tax History
| Year | Tax Paid | Tax Assessment Tax Assessment Total Assessment is a certain percentage of the fair market value that is determined by local assessors to be the total taxable value of land and additions on the property. | Land | Improvement |
|---|---|---|---|---|
| 2025 | $834 | $75,478 | $52,130 | $23,348 |
| 2024 | $814 | $74,507 | $51,108 | $23,399 |
| 2023 | $814 | $72,756 | $50,106 | $22,650 |
| 2022 | $790 | $71,003 | $49,124 | $21,879 |
| 2021 | $760 | $67,946 | $48,161 | $19,785 |
| 2020 | $751 | $67,279 | $47,668 | $19,611 |
| 2019 | $744 | $66,216 | $46,734 | $19,482 |
| 2018 | $718 | $65,173 | $45,818 | $19,355 |
| 2017 | $730 | $64,151 | $44,920 | $19,231 |
| 2016 | $694 | $63,149 | $44,040 | $19,109 |
| 2015 | $695 | $62,397 | $43,379 | $19,018 |
| 2014 | $689 | $61,431 | $42,530 | $18,901 |
Source: Public Records
Map
Nearby Homes
- 6766 Drake Dr
- 20650 Matamoros St
- 6734 Meadowlark Ln
- 20539 Sunset Ln
- 6594 Clear View Dr
- 20350 Hole In 1 Dr
- 20350 Hole in One Dr
- 20340 Greenview Dr
- 20480 River Valley Dr
- 7530 Lockheed Dr
- 7520 Lockheed Dr
- 7045 Hermosa Way
- 7100 Amigo Way
- 20260 River Valley Dr
- 7353 Amigo Way
- 7587 Fiesta Way
- 6352 Park Ridge Dr
- 20250 River Valley Dr
- 7057 Riata Dr
- 7540 Lockheed Dr
- 7028 Autumn Way
- 7036 Arlin Ln
- 20978 Fig Tree Ln
- 7014 Autumn Way
- 7014 Autumn Way
- 4860 Fig Tree Ln
- 7018 Arlin Ln
- 7046 Autumn Way
- 7019 Arlin Ln
- 7027 Primrose Ln*pvrm #1*
- 7027 Primrose Ln
- 7037 Arlin Ln
- 7037 Arline Ln
- 20998 Fig Tree Ln
- 20930 Fig Tree Ln
- 0000000 Primrose Ln
- 7048 Arlin Ln
- 7016 Primrose Ln
- 7050 Primrose Ln
- 7066 Primrose Ln