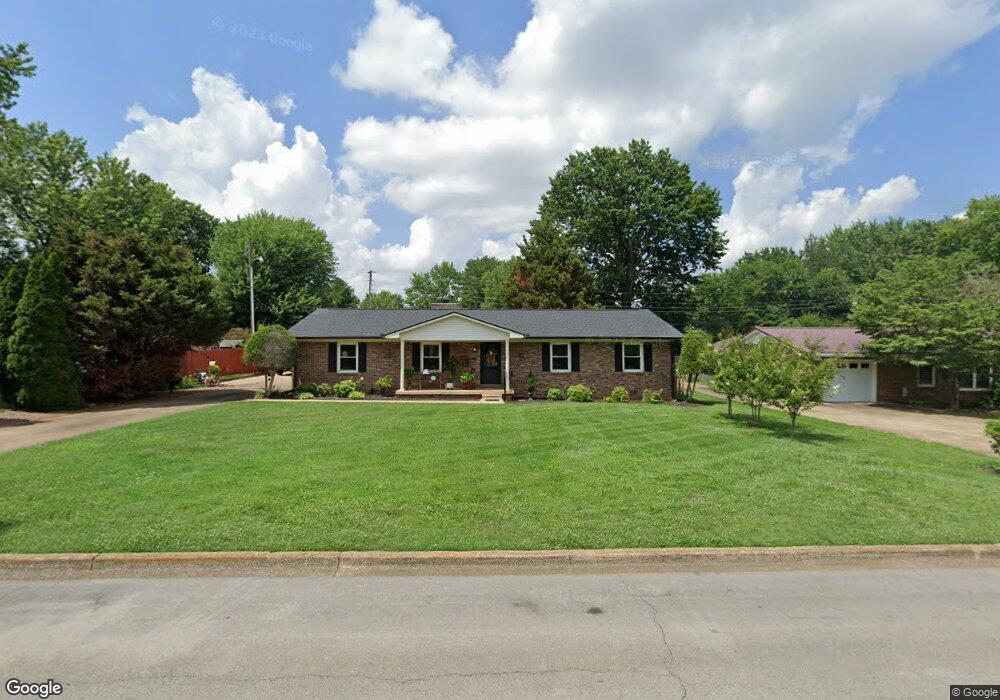
702 4th St Lawrenceburg, TN 38464
Estimated Value: $264,474 - $270,000
--
Bed
2
Baths
1,891
Sq Ft
$141/Sq Ft
Est. Value
About This Home
This home is located at 702 4th St, Lawrenceburg, TN 38464 and is currently estimated at $266,119, approximately $140 per square foot. 702 4th St is a home located in Lawrence County with nearby schools including Ingram Sowell Elementary School, Lawrenceburg Public Elementary School, and David Crockett Elementary School.
Ownership History
Date
Name
Owned For
Owner Type
Purchase Details
Closed on
Apr 7, 2021
Sold by
Bryant Gean F and White Laura
Bought by
Gatewood Linda
Current Estimated Value
Purchase Details
Closed on
Jul 21, 2005
Sold by
Michael Dixon
Bought by
Bryant Gean F
Purchase Details
Closed on
Apr 15, 1992
Bought by
Dixon Michael and Dixon Nell
Purchase Details
Closed on
Oct 18, 1989
Bought by
Joiner Bennie L
Purchase Details
Closed on
Nov 24, 1978
Bought by
Beck Oren O
Create a Home Valuation Report for This Property
The Home Valuation Report is an in-depth analysis detailing your home's value as well as a comparison with similar homes in the area
Home Values in the Area
Average Home Value in this Area
Purchase History
| Date | Buyer | Sale Price | Title Company |
|---|---|---|---|
| Gatewood Linda | $165,000 | None Available | |
| Bryant Gean F | $139,000 | -- | |
| Dixon Michael | $71,900 | -- | |
| Joiner Bennie L | -- | -- | |
| Beck Oren O | -- | -- |
Source: Public Records
Tax History Compared to Growth
Tax History
| Year | Tax Paid | Tax Assessment Tax Assessment Total Assessment is a certain percentage of the fair market value that is determined by local assessors to be the total taxable value of land and additions on the property. | Land | Improvement |
|---|---|---|---|---|
| 2025 | $1,580 | $50,850 | $0 | $0 |
| 2024 | $1,580 | $50,850 | $3,750 | $47,100 |
| 2023 | $1,580 | $50,850 | $3,750 | $47,100 |
| 2022 | $1,580 | $50,850 | $3,750 | $47,100 |
| 2021 | $1,488 | $33,850 | $2,500 | $31,350 |
| 2020 | $1,488 | $33,850 | $2,500 | $31,350 |
| 2019 | $1,488 | $33,850 | $2,500 | $31,350 |
| 2018 | $1,488 | $33,850 | $2,500 | $31,350 |
| 2017 | $1,488 | $33,850 | $2,500 | $31,350 |
| 2016 | $1,488 | $33,850 | $2,500 | $31,350 |
| 2015 | $1,409 | $33,850 | $2,500 | $31,350 |
| 2014 | $1,352 | $32,475 | $2,500 | $29,975 |
Source: Public Records
Map
Nearby Homes