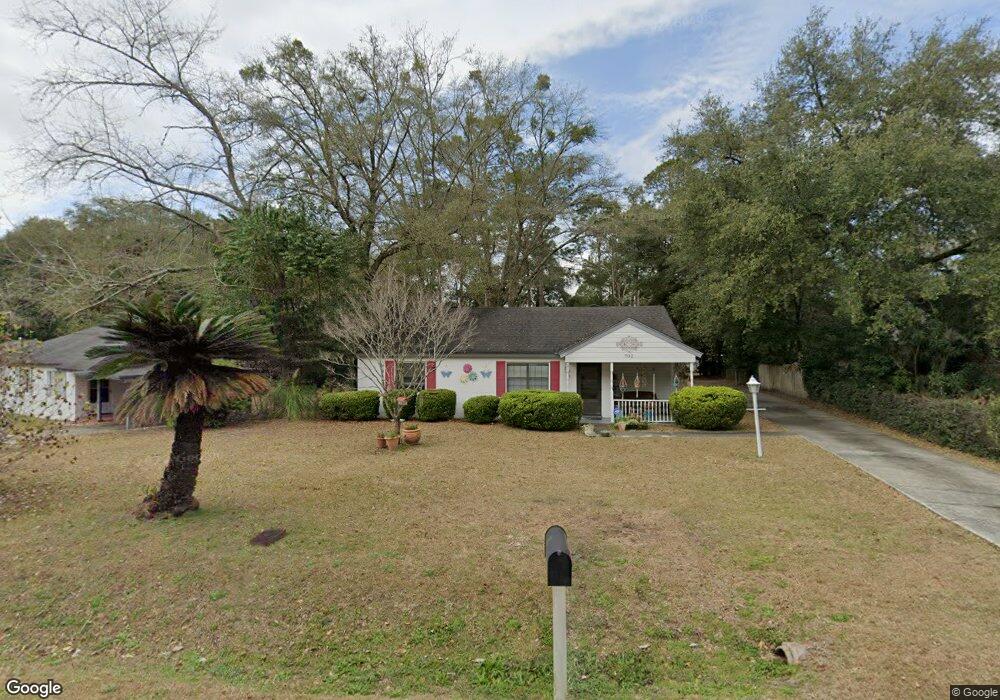
702 Azalea Cir Valdosta, GA 31602
Estimated Value: $167,995 - $186,000
--
Bed
1
Bath
1,198
Sq Ft
$148/Sq Ft
Est. Value
About This Home
This home is located at 702 Azalea Cir, Valdosta, GA 31602 and is currently estimated at $177,749, approximately $148 per square foot. 702 Azalea Cir is a home located in Lowndes County with nearby schools including S.L. Mason Elementary School, Valdosta Middle School, and Valdosta High School.
Ownership History
Date
Name
Owned For
Owner Type
Purchase Details
Closed on
Feb 7, 2024
Sold by
Pilgram Robert J
Bought by
Pilgrim Rebecca L and Pilgrim Robert J
Current Estimated Value
Purchase Details
Closed on
Dec 1, 1987
Bought by
Pilgrim Robert J and Pilgrim Rebe
Purchase Details
Closed on
Nov 23, 1987
Bought by
Coats David Scott
Purchase Details
Closed on
Nov 16, 1987
Bought by
Coats David Scott
Purchase Details
Closed on
Aug 1, 1985
Bought by
Coats David Scott
Purchase Details
Closed on
Aug 16, 1982
Bought by
Thornton John Michael
Purchase Details
Closed on
Jul 6, 1982
Bought by
Dickey Marvin H
Purchase Details
Closed on
Oct 17, 1978
Bought by
Kenyon Gilbert Grant
Purchase Details
Closed on
Jul 22, 1969
Bought by
Owens James Herbert
Purchase Details
Closed on
Dec 9, 1963
Bought by
Folson Clarence Eugene
Create a Home Valuation Report for This Property
The Home Valuation Report is an in-depth analysis detailing your home's value as well as a comparison with similar homes in the area
Home Values in the Area
Average Home Value in this Area
Purchase History
| Date | Buyer | Sale Price | Title Company |
|---|---|---|---|
| Pilgrim Rebecca L | -- | -- | |
| Pilgrim Robert J | $43,500 | -- | |
| Coats David Scott | -- | -- | |
| Coats David Scott | -- | -- | |
| Coats David Scott | $38,000 | -- | |
| Thornton John Michael | $12,800 | -- | |
| Dickey Marvin H | $5,500 | -- | |
| Kenyon Gilbert Grant | -- | -- | |
| Owens James Herbert | $2,500 | -- | |
| Folson Clarence Eugene | -- | -- |
Source: Public Records
Tax History Compared to Growth
Tax History
| Year | Tax Paid | Tax Assessment Tax Assessment Total Assessment is a certain percentage of the fair market value that is determined by local assessors to be the total taxable value of land and additions on the property. | Land | Improvement |
|---|---|---|---|---|
| 2024 | $1,490 | $59,358 | $10,515 | $48,843 |
| 2023 | $1,490 | $59,358 | $10,515 | $48,843 |
| 2022 | $921 | $33,263 | $10,515 | $22,748 |
| 2021 | $1,004 | $34,884 | $10,515 | $24,369 |
| 2020 | $1,026 | $34,884 | $10,515 | $24,369 |
| 2019 | $1,025 | $34,884 | $10,515 | $24,369 |
| 2018 | $1,039 | $34,884 | $10,515 | $24,369 |
| 2017 | $1,046 | $34,884 | $10,515 | $24,369 |
| 2016 | $1,044 | $34,884 | $10,515 | $24,369 |
| 2015 | -- | $34,884 | $10,515 | $24,369 |
| 2014 | $975 | $34,884 | $10,515 | $24,369 |
Source: Public Records
Map
Nearby Homes
- 604 Azalea Cir
- 2112 Azalea Dr
- 2206 White Oak Dr
- 68 Pineridge Dr
- 2211 Jerry Jones Dr
- 1909 Azalea Dr
- 2217 Brighton Place
- 2105 Jerry Jones Dr
- 814 W Alden Ave
- 2325 White Oak Dr
- 2014 Delvid St
- 817 W Cranford Ave
- 903 Gornto Rd
- 908 Maplewood Dr
- 309 W Park Ave
- 1104 Linda Dr
- 5 Dellwood Cir
- 1 Fox Hollow Cir
- 2208 N Oak St
- 300 Georgia Ave
- 704 Azalea Cir
- 700 Azalea Cir
- 606 Azalea Cir
- 11 Loganberry Cir
- 13 Loganberry Cir
- 9 Loganberry Cir
- 708 Azalea Cir
- 701 Azalea Cir Unit 1
- 703 Azalea Cir
- 2115 Hillcrest Dr
- 7 Loganberry Cir
- 15 Loganberry Cir
- 705 Azalea Cir
- 707 Azalea Cir
- 2110 Hillcrest Dr
- 2113 Hillcrest Dr
- 5 Loganberry Cir
- 602 Azalea Cir
- 712 Azalea Cir
- 603 Azalea Cir