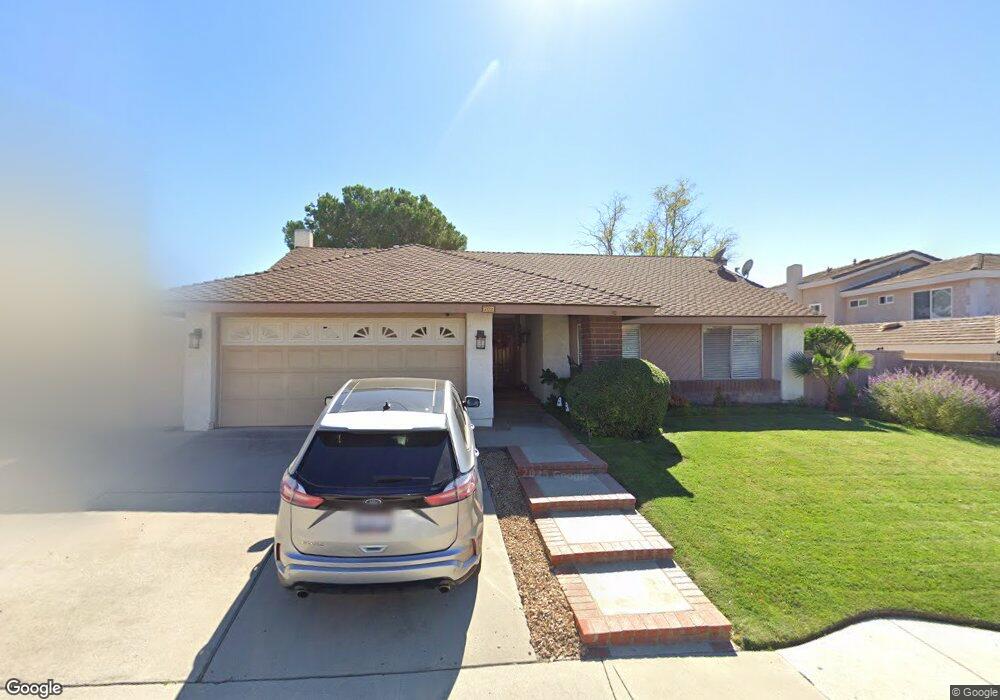
702 Azalea St Thousand Oaks, CA 91360
Estimated Value: $940,680 - $1,043,000
3
Beds
2
Baths
1,569
Sq Ft
$642/Sq Ft
Est. Value
About This Home
This home is located at 702 Azalea St, Thousand Oaks, CA 91360 and is currently estimated at $1,006,920, approximately $641 per square foot. 702 Azalea St is a home located in Ventura County with nearby schools including Wildwood Elementary School, Redwood Middle School, and Thousand Oaks High School.
Ownership History
Date
Name
Owned For
Owner Type
Purchase Details
Closed on
Dec 2, 2022
Sold by
Humphrey Mary Jo
Bought by
Humphrey Sean Colin and Humphrey Amanda Jane
Current Estimated Value
Home Financials for this Owner
Home Financials are based on the most recent Mortgage that was taken out on this home.
Original Mortgage
$564,000
Outstanding Balance
$545,895
Interest Rate
6.58%
Mortgage Type
New Conventional
Estimated Equity
$461,025
Purchase Details
Closed on
Oct 12, 2017
Sold by
Vlasich Julie and The 2003 Vlasich Family Living
Bought by
Humphrey Mary Jo
Home Financials for this Owner
Home Financials are based on the most recent Mortgage that was taken out on this home.
Original Mortgage
$235,000
Interest Rate
3.78%
Mortgage Type
New Conventional
Purchase Details
Closed on
Mar 14, 2003
Sold by
Vlasich Frank A and Vlasich Josephine
Bought by
Vlasich Frank A and Vlasich Josephine R
Create a Home Valuation Report for This Property
The Home Valuation Report is an in-depth analysis detailing your home's value as well as a comparison with similar homes in the area
Purchase History
| Date | Buyer | Sale Price | Title Company |
|---|---|---|---|
| Humphrey Sean Colin | $830,000 | California Title Company | |
| Humphrey Mary Jo | $235,000 | Chicago Title Company | |
| Vlasich Frank A | -- | -- |
Source: Public Records
Mortgage History
| Date | Status | Borrower | Loan Amount |
|---|---|---|---|
| Open | Humphrey Sean Colin | $564,000 | |
| Previous Owner | Humphrey Mary Jo | $235,000 |
Source: Public Records
Tax History
| Year | Tax Paid | Tax Assessment Tax Assessment Total Assessment is a certain percentage of the fair market value that is determined by local assessors to be the total taxable value of land and additions on the property. | Land | Improvement |
|---|---|---|---|---|
| 2025 | $9,670 | $863,532 | $561,296 | $302,236 |
| 2024 | $9,670 | $846,600 | $550,290 | $296,310 |
| 2023 | $7,083 | $601,399 | $379,179 | $222,220 |
| 2022 | $6,947 | $589,607 | $371,744 | $217,863 |
| 2021 | $6,813 | $578,047 | $364,455 | $213,592 |
| 2020 | $6,367 | $572,121 | $360,719 | $211,402 |
| 2019 | $6,198 | $560,904 | $353,647 | $207,257 |
| 2018 | $6,072 | $549,907 | $346,713 | $203,194 |
| 2017 | $2,053 | $171,209 | $68,481 | $102,728 |
| 2016 | $2,027 | $167,853 | $67,139 | $100,714 |
| 2015 | $1,988 | $165,334 | $66,132 | $99,202 |
| 2014 | $1,956 | $162,097 | $64,838 | $97,259 |
Source: Public Records
Map
Nearby Homes
- 3001 Sunflower St
- 3324 Big Cloud Cir
- 2680 La Paloma Cir
- 3141 Wild Horse Ct
- 458 Serento Cir
- 2839 Trillium St
- 2144 Sirius St
- 644 Camino de Celeste
- 751 Wildwood Ave
- 334 W Avenida de Las Flores
- 224 Longfellow St
- 205 Cedar Heights Dr
- 250 W Avenida de Las Flores
- 2769 Beckett Ct
- 181 W Avenida de Las Flores
- 2050 Truett Cir
- 2026 Stonehill Cir
- 285 Siesta Ave
- 136 Erten St
- 1926 Calle Yucca
- 710 Azalea St
- 694 Azalea St
- 2904 Sunflower St
- 718 Azalea St
- 686 Azalea St
- 2905 Sunflower St
- 2916 Sunflower St
- 726 Azalea St
- 693 Azalea St
- 678 Garland Ct
- 672 Garland Ct
- 2917 Sunflower St
- 2928 Sunflower St
- 734 Azalea St
- 679 Azalea St
- 735 Azalea St
- 2929 Sunflower St
- 2940 Sunflower St
- 660 Azalea St
- 742 Azalea St
Your Personal Tour Guide
Ask me questions while you tour the home.