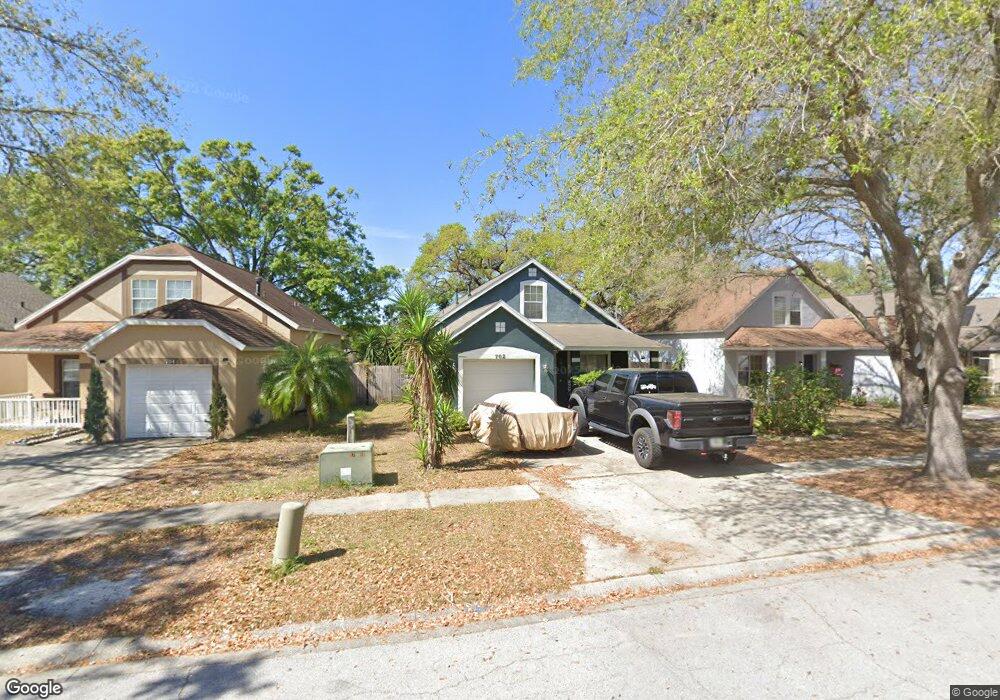
702 Cape Cod Cir Valrico, FL 33594
Estimated Value: $289,000 - $311,000
3
Beds
2
Baths
1,402
Sq Ft
$216/Sq Ft
Est. Value
About This Home
This home is located at 702 Cape Cod Cir, Valrico, FL 33594 and is currently estimated at $303,161, approximately $216 per square foot. 702 Cape Cod Cir is a home located in Hillsborough County with nearby schools including Nelson Elementary School, Mulrennan Middle School, and Durant High School.
Ownership History
Date
Name
Owned For
Owner Type
Purchase Details
Closed on
Jul 8, 2010
Sold by
United States Of America
Bought by
Carpenter Jeremy
Current Estimated Value
Home Financials for this Owner
Home Financials are based on the most recent Mortgage that was taken out on this home.
Original Mortgage
$113,471
Outstanding Balance
$76,214
Interest Rate
5.25%
Mortgage Type
FHA
Estimated Equity
$226,947
Purchase Details
Closed on
Jun 29, 2010
Sold by
Jemmott Shirlon and Jemmott Danisha J
Bought by
United States Of America
Home Financials for this Owner
Home Financials are based on the most recent Mortgage that was taken out on this home.
Original Mortgage
$113,471
Outstanding Balance
$76,214
Interest Rate
5.25%
Mortgage Type
FHA
Estimated Equity
$226,947
Purchase Details
Closed on
Jan 12, 2006
Sold by
Slater Colleen M
Bought by
Jemmott Shirlon
Home Financials for this Owner
Home Financials are based on the most recent Mortgage that was taken out on this home.
Original Mortgage
$194,085
Interest Rate
6.22%
Mortgage Type
VA
Create a Home Valuation Report for This Property
The Home Valuation Report is an in-depth analysis detailing your home's value as well as a comparison with similar homes in the area
Home Values in the Area
Average Home Value in this Area
Purchase History
| Date | Buyer | Sale Price | Title Company |
|---|---|---|---|
| Carpenter Jeremy | $115,000 | Attorney | |
| United States Of America | $183,119 | Attorney | |
| Jemmott Shirlon | $190,000 | Acr Title Group Lllp |
Source: Public Records
Mortgage History
| Date | Status | Borrower | Loan Amount |
|---|---|---|---|
| Open | Carpenter Jeremy | $113,471 | |
| Previous Owner | Jemmott Shirlon | $194,085 |
Source: Public Records
Tax History
| Year | Tax Paid | Tax Assessment Tax Assessment Total Assessment is a certain percentage of the fair market value that is determined by local assessors to be the total taxable value of land and additions on the property. | Land | Improvement |
|---|---|---|---|---|
| 2025 | $3,808 | $220,406 | $53,317 | $167,089 |
| 2024 | $3,808 | $222,830 | $55,741 | $167,089 |
| 2023 | $3,721 | $194,613 | $48,470 | $146,143 |
| 2022 | $3,454 | $191,417 | $48,470 | $142,947 |
| 2021 | $3,073 | $147,202 | $33,929 | $113,273 |
| 2020 | $2,757 | $127,413 | $32,718 | $94,695 |
| 2019 | $2,963 | $124,543 | $33,929 | $90,614 |
| 2018 | $2,815 | $114,776 | $0 | $0 |
| 2017 | $2,718 | $108,621 | $0 | $0 |
| 2016 | $2,641 | $104,075 | $0 | $0 |
| 2015 | $2,514 | $94,614 | $0 | $0 |
| 2014 | $2,391 | $86,013 | $0 | $0 |
| 2013 | -- | $78,194 | $0 | $0 |
Source: Public Records
Map
Nearby Homes
- 630 Cape Cod Cir
- 807 Cape Cod Cir
- 755 Cape Cod Cir
- 3412 Palm Beach Dr
- 512 Cape Cod Cir
- 605 Choo Ln Unit 503
- 516 Klickety Klak Ln Unit 544
- 3502 Petticoat Jct Unit 447
- 837 Rocky Mountain Ct
- 502 Little Eagle Ct
- 404 Boxcar Way Unit 557
- 3516 Zephyr Ln
- 3510 Petticoat Jct
- 326 Choo Ln Unit 478
- 726 Choo Ln Unit 726F
- 3515 Zephyr Ln
- 3602 Cinder Dr
- 402 Caboose Ln Unit 574
- 252 Taho Cir Unit 252
- 250 Taho Cir
- 704 Cape Cod Cir
- 706 Cape Cod Cir
- 628 Cape Cod Cir
- 626 Cape Cod Cir
- 708 Cape Cod Cir
- 715 Cape Cod Cir
- 703 Cape Cod Cir
- 629 Cape Cod Cir
- 624 Cape Cod Cir
- 718 Cape Cod Cir
- 627 Cape Cod Cir
- 710 Cape Cod Cir
- 717 Cape Cod Cir
- 625 Cape Cod Cir
- 712 Cape Cod Cir
- 3403 Long Island Way
- 3404 Long Island Way
- 719 Cape Cod Cir
- 714 Cape Cod Cir
- 620 Cape Cod Cir
Your Personal Tour Guide
Ask me questions while you tour the home.