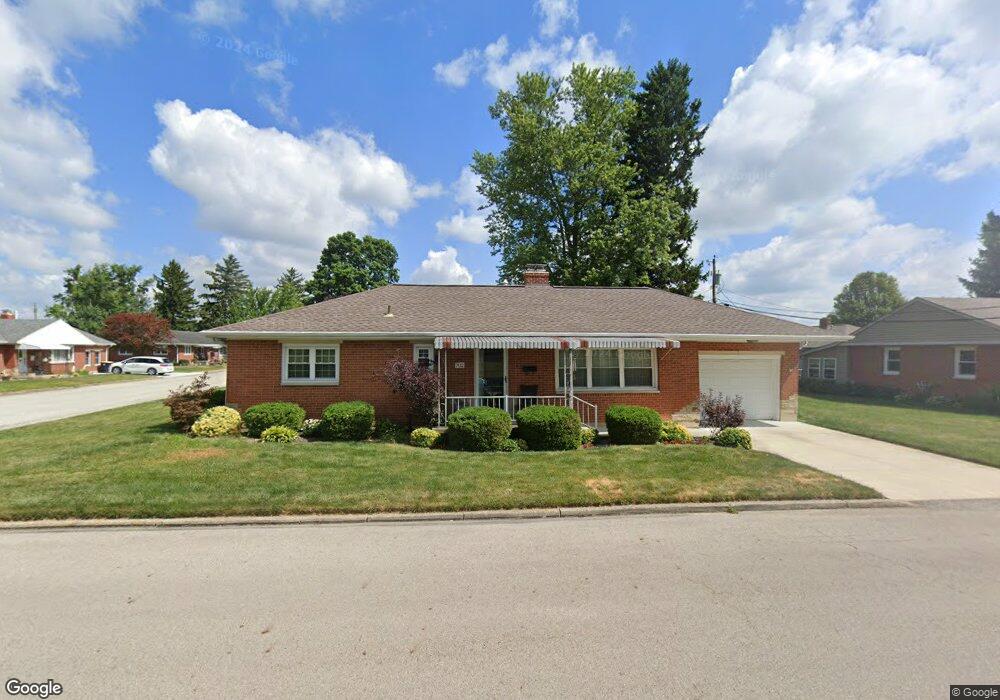
702 Chestnut St Covington, OH 45318
Estimated Value: $172,000 - $185,642
3
Beds
1
Bath
1,215
Sq Ft
$147/Sq Ft
Est. Value
About This Home
This home is located at 702 Chestnut St, Covington, OH 45318 and is currently estimated at $178,661, approximately $147 per square foot. 702 Chestnut St is a home located in Miami County with nearby schools including Covington Elementary/Junior High School, Covington Junior High School, and Covington High School.
Ownership History
Date
Name
Owned For
Owner Type
Purchase Details
Closed on
Oct 6, 2003
Sold by
Foster Rose M
Bought by
Cook Michael
Current Estimated Value
Home Financials for this Owner
Home Financials are based on the most recent Mortgage that was taken out on this home.
Original Mortgage
$83,500
Interest Rate
6.4%
Mortgage Type
New Conventional
Purchase Details
Closed on
Oct 1, 1978
Bought by
Foster Richard W
Create a Home Valuation Report for This Property
The Home Valuation Report is an in-depth analysis detailing your home's value as well as a comparison with similar homes in the area
Home Values in the Area
Average Home Value in this Area
Purchase History
| Date | Buyer | Sale Price | Title Company |
|---|---|---|---|
| Cook Michael | $87,900 | -- | |
| Foster Richard W | $36,500 | -- |
Source: Public Records
Mortgage History
| Date | Status | Borrower | Loan Amount |
|---|---|---|---|
| Previous Owner | Cook Michael | $83,500 |
Source: Public Records
Tax History
| Year | Tax Paid | Tax Assessment Tax Assessment Total Assessment is a certain percentage of the fair market value that is determined by local assessors to be the total taxable value of land and additions on the property. | Land | Improvement |
|---|---|---|---|---|
| 2025 | $1,277 | $59,050 | $9,840 | $49,210 |
| 2024 | $1,277 | $43,230 | $10,640 | $32,590 |
| 2023 | $1,260 | $43,230 | $10,640 | $32,590 |
| 2022 | $1,295 | $43,230 | $10,640 | $32,590 |
| 2021 | $996 | $33,250 | $8,190 | $25,060 |
| 2020 | $998 | $33,250 | $8,190 | $25,060 |
| 2019 | $1,003 | $33,250 | $8,190 | $25,060 |
| 2018 | $798 | $28,150 | $6,410 | $21,740 |
| 2017 | $812 | $28,150 | $6,410 | $21,740 |
| 2016 | $803 | $28,150 | $6,410 | $21,740 |
| 2015 | $727 | $27,060 | $6,160 | $20,900 |
| 2014 | $727 | $27,060 | $6,160 | $20,900 |
| 2013 | $1,021 | $27,060 | $6,160 | $20,900 |
Source: Public Records
Map
Nearby Homes
Your Personal Tour Guide
Ask me questions while you tour the home.