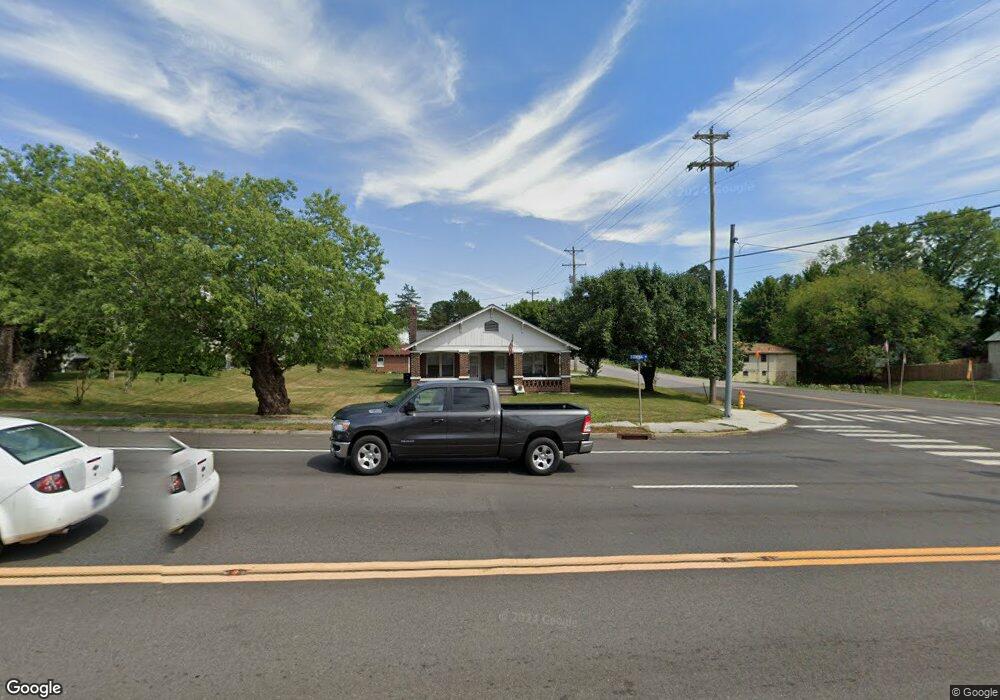
702 E Central Ave La Follette, TN 37766
Estimated Value: $189,452 - $207,000
3
Beds
1
Bath
1,496
Sq Ft
$132/Sq Ft
Est. Value
About This Home
This home is located at 702 E Central Ave, La Follette, TN 37766 and is currently estimated at $197,863, approximately $132 per square foot. 702 E Central Ave is a home located in Campbell County with nearby schools including Calvary Christian Academy.
Ownership History
Date
Name
Owned For
Owner Type
Purchase Details
Closed on
Aug 11, 2025
Sold by
Cowan Mary C
Bought by
Finchum James and Finchum Audrey
Current Estimated Value
Home Financials for this Owner
Home Financials are based on the most recent Mortgage that was taken out on this home.
Original Mortgage
$190,000
Outstanding Balance
$189,834
Interest Rate
6.67%
Mortgage Type
New Conventional
Estimated Equity
$8,029
Purchase Details
Closed on
Apr 14, 2022
Sold by
Dan Robinson William
Bought by
Cowan Mary C
Home Financials for this Owner
Home Financials are based on the most recent Mortgage that was taken out on this home.
Original Mortgage
$184,000
Interest Rate
4.63%
Mortgage Type
New Conventional
Purchase Details
Closed on
Mar 17, 2016
Sold by
Robinson Joyce W
Bought by
Robinson Joyce W Revocable Trust
Purchase Details
Closed on
Feb 23, 2012
Sold by
Evans William P
Bought by
Robinson William S and Robinson Joyce W
Purchase Details
Closed on
Jul 31, 1998
Sold by
Riggs Viola
Bought by
Evans William
Create a Home Valuation Report for This Property
The Home Valuation Report is an in-depth analysis detailing your home's value as well as a comparison with similar homes in the area
Home Values in the Area
Average Home Value in this Area
Purchase History
| Date | Buyer | Sale Price | Title Company |
|---|---|---|---|
| Finchum James | $200,000 | None Listed On Document | |
| Cowan Mary C | $183,783 | None Listed On Document | |
| Robinson Joyce W Revocable Trust | -- | -- | |
| Robinson William S | $43,000 | -- | |
| Evans William | $78,000 | -- |
Source: Public Records
Mortgage History
| Date | Status | Borrower | Loan Amount |
|---|---|---|---|
| Open | Finchum James | $190,000 | |
| Previous Owner | Cowan Mary C | $184,000 |
Source: Public Records
Tax History
| Year | Tax Paid | Tax Assessment Tax Assessment Total Assessment is a certain percentage of the fair market value that is determined by local assessors to be the total taxable value of land and additions on the property. | Land | Improvement |
|---|---|---|---|---|
| 2025 | -- | $38,250 | $13,575 | $24,675 |
| 2024 | -- | $38,250 | $13,575 | $24,675 |
| 2023 | $713 | $21,225 | $6,450 | $14,775 |
| 2022 | $713 | $21,225 | $6,450 | $14,775 |
| 2021 | $537 | $15,975 | $6,450 | $9,525 |
| 2020 | $526 | $15,975 | $6,450 | $9,525 |
| 2019 | $537 | $15,975 | $6,450 | $9,525 |
| 2018 | $744 | $20,975 | $10,000 | $10,975 |
| 2017 | $744 | $20,975 | $10,000 | $10,975 |
| 2016 | $744 | $20,975 | $10,000 | $10,975 |
| 2015 | $689 | $20,975 | $10,000 | $10,975 |
| 2014 | $689 | $20,975 | $10,000 | $10,975 |
| 2013 | -- | $20,975 | $10,000 | $10,975 |
Source: Public Records
Map
Nearby Homes
- 608 E Walden St
- 108 N 8th St
- 508 E Central Ave
- 306 E Walden St
- 712 E Fir St
- 509 E Hemlock St
- 508 E Hemlock St
- 1107 E Elm St
- 713 E Kentucky Ave
- 206 E Chestnut St
- 115 E Morningside Park
- 0 Martha Lee Ln
- 111 Jessica Ln
- 310 W Kentucky Ave
- 414 W Ash St
- 0 Fairway Dr Unit 1306388
- 517 Cherry St
- 0 W Hemlock St
- 124 Mohawk Trail
- 203 Golf Hill Ln
- 706 E Central Ave
- 708 E Central Ave
- 703 E Ash St
- 705 E Ash St
- 710 E Central Ave
- 106 S Cumberland Ave
- 707 E Ash St
- 108 S Cumberland Ave
- 711 E Central Ave
- 709 E Ash St
- 703 E Central Ave
- 612 E Central Ave
- 110 S Cumberland Ave
- 707 E Central Ave
- 611 E Ash St
- 711 E Ash St
- 617 E Central Ave
- 716 E Central Ave
- 615 E Central Ave
- 610 E Central Ave
Your Personal Tour Guide
Ask me questions while you tour the home.