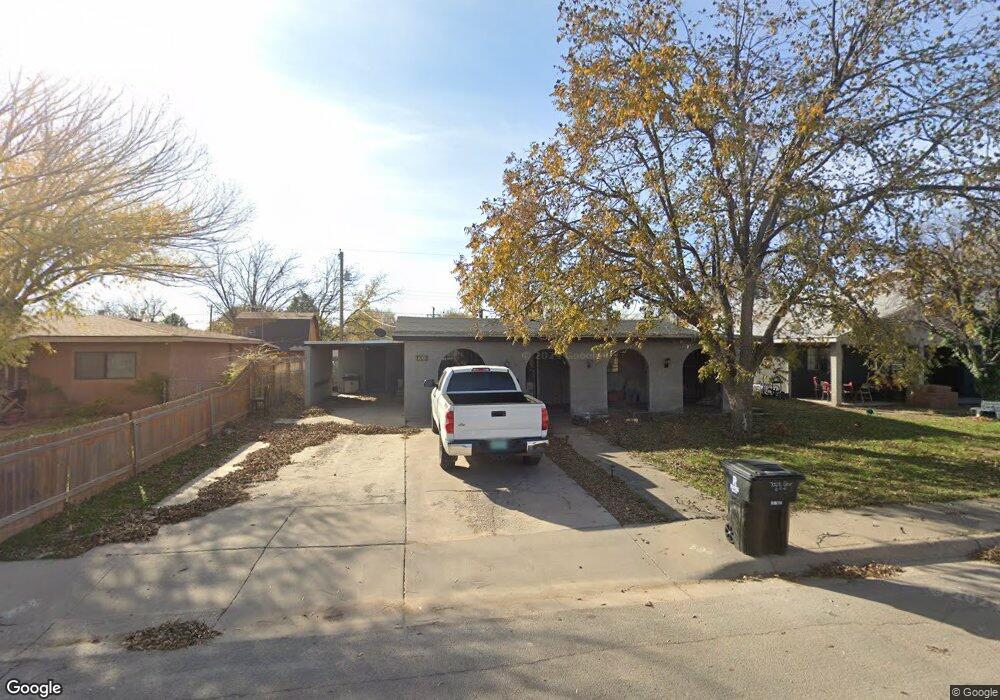
702 Grove St Roswell, NM 88201
Estimated Value: $75,000 - $107,226
4
Beds
1
Bath
1,482
Sq Ft
$66/Sq Ft
Est. Value
About This Home
This home is located at 702 Grove St, Roswell, NM 88201 and is currently estimated at $97,807, approximately $65 per square foot. 702 Grove St is a home located in Chaves County with nearby schools including Washington Avenue Elementary School, Sierra Middle School, and Goddard High School.
Ownership History
Date
Name
Owned For
Owner Type
Purchase Details
Closed on
Apr 30, 2019
Sold by
Flores Ciprano and Delara Joaquina Marin
Bought by
Crespo Michael
Current Estimated Value
Home Financials for this Owner
Home Financials are based on the most recent Mortgage that was taken out on this home.
Original Mortgage
$70,695
Outstanding Balance
$61,901
Interest Rate
4%
Mortgage Type
Assumption
Estimated Equity
$35,906
Purchase Details
Closed on
Aug 31, 2016
Sold by
Gonzalez Martha
Bought by
Flores Ciprano and Delara Joaquina
Home Financials for this Owner
Home Financials are based on the most recent Mortgage that was taken out on this home.
Original Mortgage
$70,695
Interest Rate
4.4%
Mortgage Type
FHA
Purchase Details
Closed on
Feb 28, 2012
Sold by
Lemus Juan De Dios and Gonzalez Martha
Bought by
Gonzalez Martha
Create a Home Valuation Report for This Property
The Home Valuation Report is an in-depth analysis detailing your home's value as well as a comparison with similar homes in the area
Home Values in the Area
Average Home Value in this Area
Purchase History
| Date | Buyer | Sale Price | Title Company |
|---|---|---|---|
| Crespo Michael | -- | Servicelink | |
| Flores Ciprano | -- | Fidelity National Title Insu | |
| Gonzalez Martha | -- | None Available |
Source: Public Records
Mortgage History
| Date | Status | Borrower | Loan Amount |
|---|---|---|---|
| Open | Crespo Michael | $70,695 | |
| Previous Owner | Flores Ciprano | $70,695 |
Source: Public Records
Tax History Compared to Growth
Tax History
| Year | Tax Paid | Tax Assessment Tax Assessment Total Assessment is a certain percentage of the fair market value that is determined by local assessors to be the total taxable value of land and additions on the property. | Land | Improvement |
|---|---|---|---|---|
| 2025 | $678 | $25,661 | $567 | $25,094 |
| 2024 | $678 | $24,914 | $567 | $24,347 |
| 2023 | $679 | $24,188 | $567 | $23,621 |
| 2022 | $700 | $25,172 | $567 | $24,605 |
| 2021 | $703 | $24,723 | $567 | $24,156 |
| 2020 | $689 | $24,231 | $567 | $23,664 |
| 2019 | $640 | $22,554 | $567 | $21,987 |
| 2018 | $620 | $21,898 | $567 | $21,331 |
| 2017 | $597 | $21,260 | $567 | $20,693 |
| 2016 | $566 | $20,375 | $565 | $19,810 |
| 2015 | $605 | $19,782 | $565 | $19,217 |
| 2014 | $1,175 | $19,206 | $565 | $18,641 |
Source: Public Records
Map
Nearby Homes
- 705 E Greenwood Dr
- 907 Norris Place
- 638 E Orange St
- 802 N Beech Ave
- 6 Pecan Place
- 120 Pear St
- 1 E Morningside Dr
- 630 E 6th St
- 618 E 6th St
- 423 E 5th St
- 304 Rowland Dr
- 707 E 3rd St
- 407 E 5th St
- 00 E 2nd St
- 1804 E College Blvd
- 620 N Main St
- 000 W Country Club & Sycamore
- 212 W 13th St
- 1308 E Alameda St
- 309 E 19th St