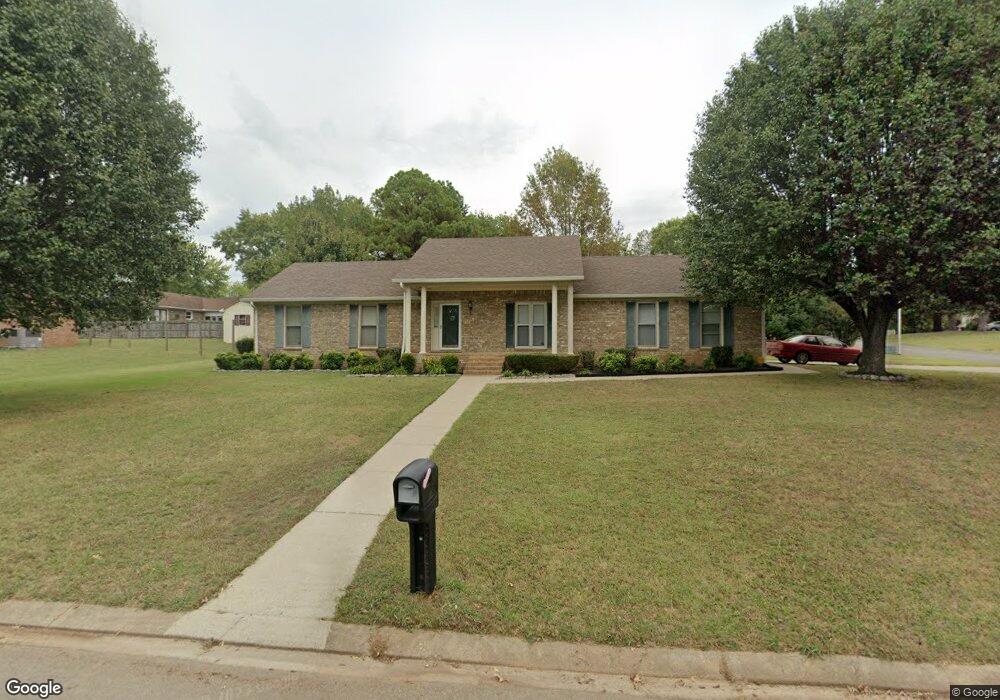
702 Irongate Blvd Murfreesboro, TN 37129
Estimated Value: $334,599 - $401,000
--
Bed
2
Baths
1,400
Sq Ft
$265/Sq Ft
Est. Value
About This Home
This home is located at 702 Irongate Blvd, Murfreesboro, TN 37129 and is currently estimated at $371,400, approximately $265 per square foot. 702 Irongate Blvd is a home located in Rutherford County with nearby schools including Northfield Elementary School, Siegel Middle School, and Siegel High School.
Ownership History
Date
Name
Owned For
Owner Type
Purchase Details
Closed on
Jul 7, 2010
Sold by
Sauls Chester
Bought by
Pendergrast Charlotte Hewell
Current Estimated Value
Home Financials for this Owner
Home Financials are based on the most recent Mortgage that was taken out on this home.
Original Mortgage
$125,875
Outstanding Balance
$83,362
Interest Rate
4.73%
Mortgage Type
Purchase Money Mortgage
Estimated Equity
$288,038
Purchase Details
Closed on
Jul 29, 2009
Sold by
Sauls Chester
Bought by
Sauls Chester
Purchase Details
Closed on
Jul 9, 2007
Sold by
Harris Kimberly C
Bought by
Chester Sauls
Home Financials for this Owner
Home Financials are based on the most recent Mortgage that was taken out on this home.
Original Mortgage
$116,000
Interest Rate
6.52%
Mortgage Type
Purchase Money Mortgage
Purchase Details
Closed on
May 16, 2002
Sold by
Demos Peter J and Demos Kristin
Bought by
Harris Kimberly C
Home Financials for this Owner
Home Financials are based on the most recent Mortgage that was taken out on this home.
Original Mortgage
$118,650
Interest Rate
6.92%
Purchase Details
Closed on
Apr 3, 2000
Sold by
Purnell Mary L
Bought by
Demos Peter J and Demos Kristin C
Purchase Details
Closed on
Apr 5, 1995
Sold by
Shipley Harold R
Bought by
Purnell Mary L
Create a Home Valuation Report for This Property
The Home Valuation Report is an in-depth analysis detailing your home's value as well as a comparison with similar homes in the area
Home Values in the Area
Average Home Value in this Area
Purchase History
| Date | Buyer | Sale Price | Title Company |
|---|---|---|---|
| Pendergrast Charlotte Hewell | $132,500 | -- | |
| Sauls Chester | -- | -- | |
| Chester Sauls | $145,000 | -- | |
| Harris Kimberly C | $124,900 | -- | |
| Demos Peter J | $118,500 | -- | |
| Purnell Mary L | $95,000 | -- |
Source: Public Records
Mortgage History
| Date | Status | Borrower | Loan Amount |
|---|---|---|---|
| Open | Purnell Mary L | $125,875 | |
| Previous Owner | Purnell Mary L | $116,000 | |
| Previous Owner | Purnell Mary L | $118,650 |
Source: Public Records
Tax History Compared to Growth
Tax History
| Year | Tax Paid | Tax Assessment Tax Assessment Total Assessment is a certain percentage of the fair market value that is determined by local assessors to be the total taxable value of land and additions on the property. | Land | Improvement |
|---|---|---|---|---|
| 2025 | $2,097 | $74,125 | $13,750 | $60,375 |
| 2024 | $2,097 | $74,125 | $13,750 | $60,375 |
| 2023 | $1,391 | $74,125 | $13,750 | $60,375 |
| 2022 | $1,198 | $74,125 | $13,750 | $60,375 |
| 2021 | $1,090 | $49,100 | $11,250 | $37,850 |
| 2020 | $1,090 | $49,100 | $11,250 | $37,850 |
| 2019 | $1,090 | $49,100 | $11,250 | $37,850 |
| 2018 | $1,497 | $49,100 | $0 | $0 |
| 2017 | $1,509 | $38,825 | $0 | $0 |
| 2016 | $1,509 | $38,825 | $0 | $0 |
| 2015 | $1,509 | $38,825 | $0 | $0 |
| 2014 | $965 | $38,825 | $0 | $0 |
| 2013 | -- | $36,400 | $0 | $0 |
Source: Public Records
Map
Nearby Homes
- 519 Irongate Blvd
- 2146 Berkshire Ln
- 2507 Regency Park Dr
- 2519 Regency Park Dr
- 1139 Victoria Dr
- 2210 Tedder Blvd
- 611 Concord Cir
- 2651 James Edmon Ct
- 615 Freedom Ct
- 610 Federal Ct
- 2014 Saddlebrook Dr
- 528 Haviture Way
- 524 Haviture Way
- 514 Haviture Way
- 2606 Battleground Dr
- 2707 Bertram Ct
- 522 Rohan Dr
- 526 Rohan Dr
- 516 Rohan Dr
- 514 Rohan Dr
- 2307 Avenal Ct
- 706 Irongate Blvd
- 606 Irongate Blvd
- 2306 Crown Hill Dr
- 611 Irongate Blvd
- 2311 Avenal Ct
- 703 Irongate Blvd
- 703 Irongate Blvd
- 703 Irongate Blvd Unit A1
- 2306 Avenal Ct
- 707 Irongate Blvd
- 2310 Crown Hill Dr
- 607 Irongate Blvd
- 2315 Avenal Ct
- 2310 Avenal Ct
- 2314 Crown Hill Dr
- 610 Thatcher Ct
- 602 Irongate Blvd
- 2303 Crown Hill Dr
- 606 Thatcher Ct