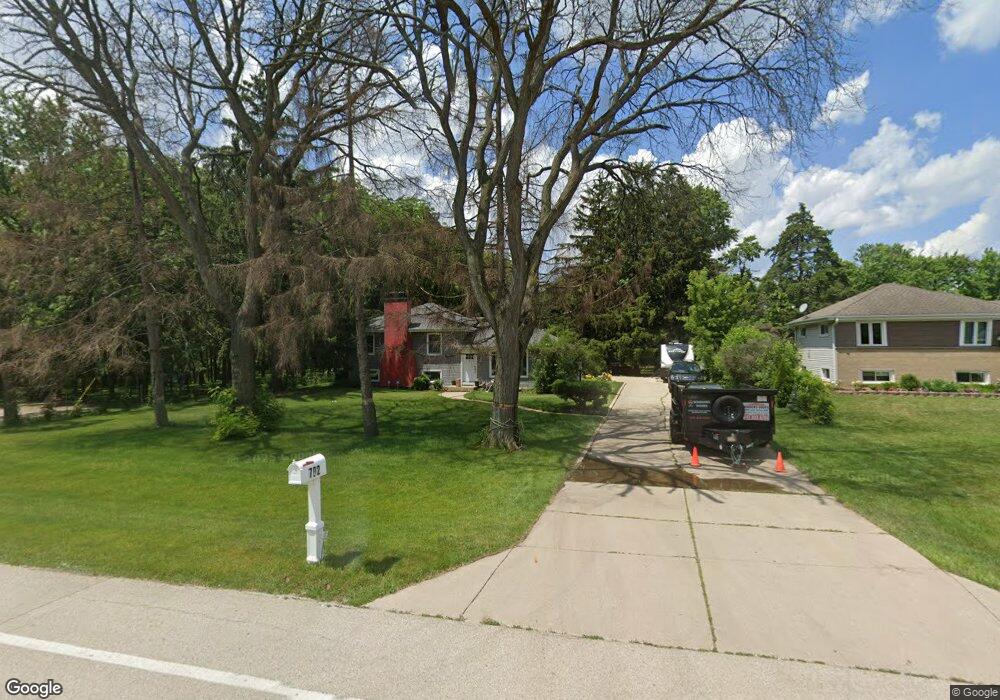
702 N Wheeling Rd Prospect Heights, IL 60070
Estimated Value: $438,000 - $616,000
3
Beds
2
Baths
1,566
Sq Ft
$318/Sq Ft
Est. Value
About This Home
This home is located at 702 N Wheeling Rd, Prospect Heights, IL 60070 and is currently estimated at $498,182, approximately $318 per square foot. 702 N Wheeling Rd is a home located in Cook County with nearby schools including Dwight D Eisenhower Elementary School, Anne Sullivan Elementary School, and Betsy Ross Elementary School.
Ownership History
Date
Name
Owned For
Owner Type
Purchase Details
Closed on
May 7, 2018
Sold by
Voicu Andra W and Voicu Razvan
Bought by
Voicu Andra W and Voicu Razvan
Current Estimated Value
Purchase Details
Closed on
Dec 20, 2017
Sold by
Carison Claire
Bought by
Voicu Andra M
Home Financials for this Owner
Home Financials are based on the most recent Mortgage that was taken out on this home.
Original Mortgage
$232,655
Outstanding Balance
$195,520
Interest Rate
3.87%
Mortgage Type
New Conventional
Estimated Equity
$302,662
Purchase Details
Closed on
Jul 29, 2016
Sold by
Carlsoon Claire
Bought by
Carlson Claire
Purchase Details
Closed on
Feb 8, 2011
Sold by
Frohnapfel James P P
Bought by
Frohnapfel James P and James P Frohnapfel Trust
Purchase Details
Closed on
Feb 13, 2008
Sold by
Frohnapfel James P and Frohnapfel Jean
Bought by
Frohnapfel James P and Frohnapfel Jean L
Create a Home Valuation Report for This Property
The Home Valuation Report is an in-depth analysis detailing your home's value as well as a comparison with similar homes in the area
Home Values in the Area
Average Home Value in this Area
Purchase History
| Date | Buyer | Sale Price | Title Company |
|---|---|---|---|
| Voicu Andra W | -- | None Available | |
| Voicu Andra M | $245,000 | Greater Illinois Title | |
| Carlson Claire | -- | Attorney | |
| Frohnapfel James P | -- | None Available | |
| Frohnapfel James P | -- | None Available |
Source: Public Records
Mortgage History
| Date | Status | Borrower | Loan Amount |
|---|---|---|---|
| Open | Voicu Andra M | $232,655 |
Source: Public Records
Tax History Compared to Growth
Tax History
| Year | Tax Paid | Tax Assessment Tax Assessment Total Assessment is a certain percentage of the fair market value that is determined by local assessors to be the total taxable value of land and additions on the property. | Land | Improvement |
|---|---|---|---|---|
| 2024 | $9,522 | $35,000 | $15,967 | $19,033 |
| 2023 | $8,898 | $35,000 | $15,967 | $19,033 |
| 2022 | $8,898 | $35,000 | $15,967 | $19,033 |
| 2021 | $6,702 | $23,769 | $9,979 | $13,790 |
| 2020 | $6,562 | $23,769 | $9,979 | $13,790 |
| 2019 | $6,555 | $26,558 | $9,979 | $16,579 |
| 2018 | $8,468 | $30,828 | $8,482 | $22,346 |
| 2017 | $8,599 | $31,506 | $8,482 | $23,024 |
| 2016 | $8,964 | $31,506 | $8,482 | $23,024 |
| 2015 | $9,751 | $31,036 | $7,484 | $23,552 |
| 2014 | $2,279 | $31,036 | $7,484 | $23,552 |
| 2013 | $2,276 | $31,036 | $7,484 | $23,552 |
Source: Public Records
Map
Nearby Homes
- 1575 Sandpebble Dr Unit 226
- 1550 Sandpebble Dr Unit 209
- 1525 Sander Ct Unit 103
- 1450 Sandpebble Dr Unit 333
- 1450 Sandpebble Dr Unit 227
- 161 Lucerne Ct Unit 111713
- 1425 Sandpebble Dr Unit 227
- 1425 Sandpebble Dr Unit 340
- 1500 Sandstone Dr Unit 307
- 150 Lucerne Ct Unit 51713
- 1430 Sandstone Dr Unit 202
- 1655 Geneva Dr Unit 43714
- 505 N Maple St
- 1376 Longacre Ln Unit 113
- 1321 Longacre Ln Unit 45
- 11 W Palatine Rd
- 13 W Kenilworth Ave
- 1201 Pleasant Run Dr Unit 312
- 703 Newcastle Ln
- 1088 Pear Tree Ln
- 704 N Wheeling Rd
- 706 N Wheeling Rd
- 705 Glendale Dr
- 707 Glendale Dr
- 703 Glendale Dr
- 708 N Wheeling Rd
- 709 Glendale Dr
- 701 Glendale Dr
- 312 E Kenilworth Ave
- 699 Glendale Dr
- 708 Glendale Dr
- 309 E Palatine Rd
- 310 E Kenilworth Ave
- 333 Wood Creek Rd
- 333 Wood Creek Rd
- 697 Glendale Dr
- 698 Glendale Dr
- 308 E Kenilworth Ave
- 306 E Kenilworth Ave
- 696 Glendale Dr