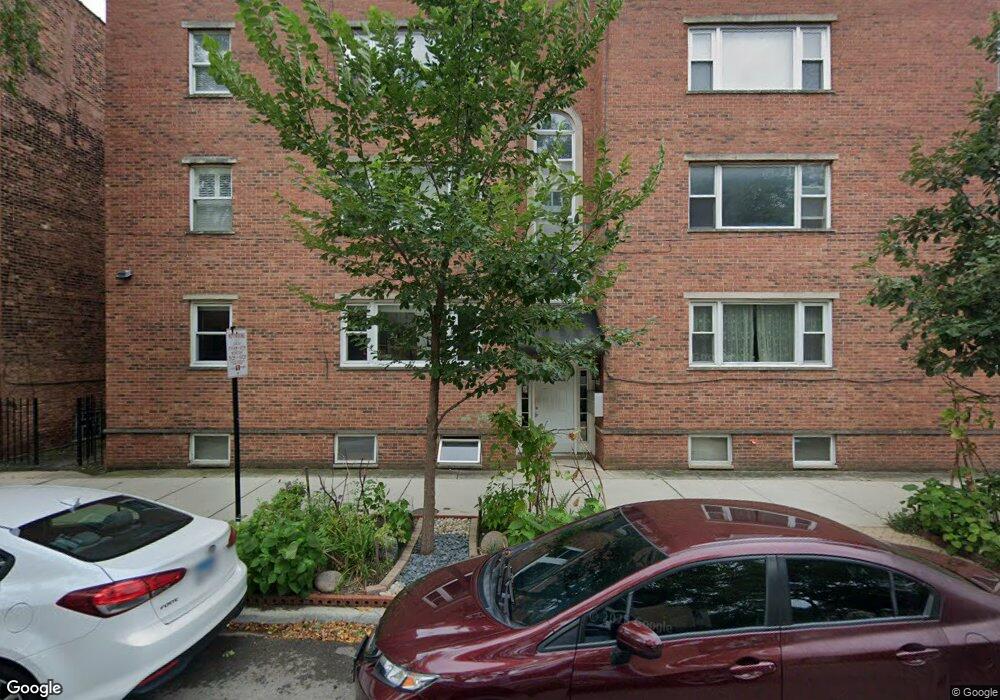
702 S Lytle St Unit 3S Chicago, IL 60607
Little Italy NeighborhoodEstimated Value: $304,000 - $437,000
2
Beds
2
Baths
900
Sq Ft
$407/Sq Ft
Est. Value
About This Home
This home is located at 702 S Lytle St Unit 3S, Chicago, IL 60607 and is currently estimated at $366,744, approximately $407 per square foot. 702 S Lytle St Unit 3S is a home located in Cook County with nearby schools including John M. Smyth Elementary I.B. World School and Wells Community Academy High School.
Ownership History
Date
Name
Owned For
Owner Type
Purchase Details
Closed on
May 12, 2011
Sold by
Finkelstein Samuel Aaron and Maloney Sheila Mary
Bought by
Husain Usuf and Husain Mansoor
Current Estimated Value
Purchase Details
Closed on
Feb 19, 2008
Sold by
Finkelstein Samuel Aaron
Bought by
Finkelstein Samuel Aaron and Maloney Sheila Mary
Purchase Details
Closed on
Jul 27, 2005
Sold by
Hauppa John T
Bought by
Finkelstein Samuel
Home Financials for this Owner
Home Financials are based on the most recent Mortgage that was taken out on this home.
Original Mortgage
$218,400
Interest Rate
5.37%
Mortgage Type
Unknown
Purchase Details
Closed on
Apr 27, 2000
Sold by
American Financial Network Inc
Bought by
Hauppa John T
Home Financials for this Owner
Home Financials are based on the most recent Mortgage that was taken out on this home.
Original Mortgage
$159,500
Interest Rate
8.21%
Purchase Details
Closed on
Feb 23, 2000
Sold by
Devon Bank
Bought by
American Financial Network Inc
Create a Home Valuation Report for This Property
The Home Valuation Report is an in-depth analysis detailing your home's value as well as a comparison with similar homes in the area
Home Values in the Area
Average Home Value in this Area
Purchase History
| Date | Buyer | Sale Price | Title Company |
|---|---|---|---|
| Husain Usuf | $219,000 | Fidelity National Title | |
| Finkelstein Samuel Aaron | -- | Chicago Title Insurance Co | |
| Finkelstein Samuel | $273,000 | Cti | |
| Hauppa John T | $189,500 | -- | |
| American Financial Network Inc | -- | -- |
Source: Public Records
Mortgage History
| Date | Status | Borrower | Loan Amount |
|---|---|---|---|
| Previous Owner | Finkelstein Samuel | $218,400 | |
| Previous Owner | Hauppa John T | $159,500 |
Source: Public Records
Tax History
| Year | Tax Paid | Tax Assessment Tax Assessment Total Assessment is a certain percentage of the fair market value that is determined by local assessors to be the total taxable value of land and additions on the property. | Land | Improvement |
|---|---|---|---|---|
| 2025 | $5,131 | $30,539 | $3,888 | $26,651 |
| 2024 | $5,131 | $30,539 | $3,888 | $26,651 |
| 2023 | $5,002 | $24,236 | $2,361 | $21,875 |
| 2022 | $5,002 | $24,236 | $2,361 | $21,875 |
| 2021 | $4,889 | $24,235 | $2,360 | $21,875 |
| 2020 | $4,997 | $22,356 | $2,360 | $19,996 |
| 2019 | $4,939 | $24,499 | $2,360 | $22,139 |
| 2018 | $4,855 | $24,499 | $2,360 | $22,139 |
| 2017 | $4,605 | $21,320 | $2,083 | $19,237 |
| 2016 | $4,270 | $21,320 | $2,083 | $19,237 |
| 2015 | $3,907 | $21,320 | $2,083 | $19,237 |
| 2014 | $3,578 | $19,287 | $1,770 | $17,517 |
| 2013 | $3,508 | $19,287 | $1,770 | $17,517 |
Source: Public Records
Map
Nearby Homes
- 1215 W Lexington St Unit J
- 1347 W Flournoy St
- 1123 W Vernon Park Place
- 234 W Polk St Unit 2802
- 234 W Polk St Unit 3603
- 234 W Polk St Unit 3612
- 234 W Polk St Unit 3107
- 234 W Polk St Unit 3307
- 234 W Polk St Unit 2610
- 234 W Polk St Unit 2310
- 234 W Polk St Unit 3708
- 234 W Polk St Unit 2509
- 234 W Polk St Unit 3310
- 234 W Polk St Unit 3704
- 234 W Polk St Unit 2808
- 234 W Polk St Unit 3503
- 234 W Polk St Unit 3701
- 234 W Polk St Unit 2806
- 234 W Polk St Unit 2905
- 234 W Polk St Unit 2409
- 1247 W Flournoy St Unit 1F
- 1247 W Flournoy St Unit 3F
- 1247 W Flournoy St Unit 2F
- 702 S Lytle St Unit 1N
- 702 S Lytle St Unit 1S
- 702 S Lytle St Unit 3N
- 702 S Lytle St Unit 2S
- 1251B W Flournoy St Unit B
- 708 S Lytle St Unit 2
- 708 S Lytle St
- 708 S Lytle St Unit 1
- 710 S Lytle St Unit 2
- 710 S Lytle St
- 710 S Lytle St Unit 3
- 710 S Lytle St
- 1253 W Flournoy St Unit 1
- 1257 W Flournoy St
- 1257 W Flournoy St Unit 2F
- 1243 W Westgate Terrace Unit 32
- 1261 W Flournoy St
Your Personal Tour Guide
Ask me questions while you tour the home.