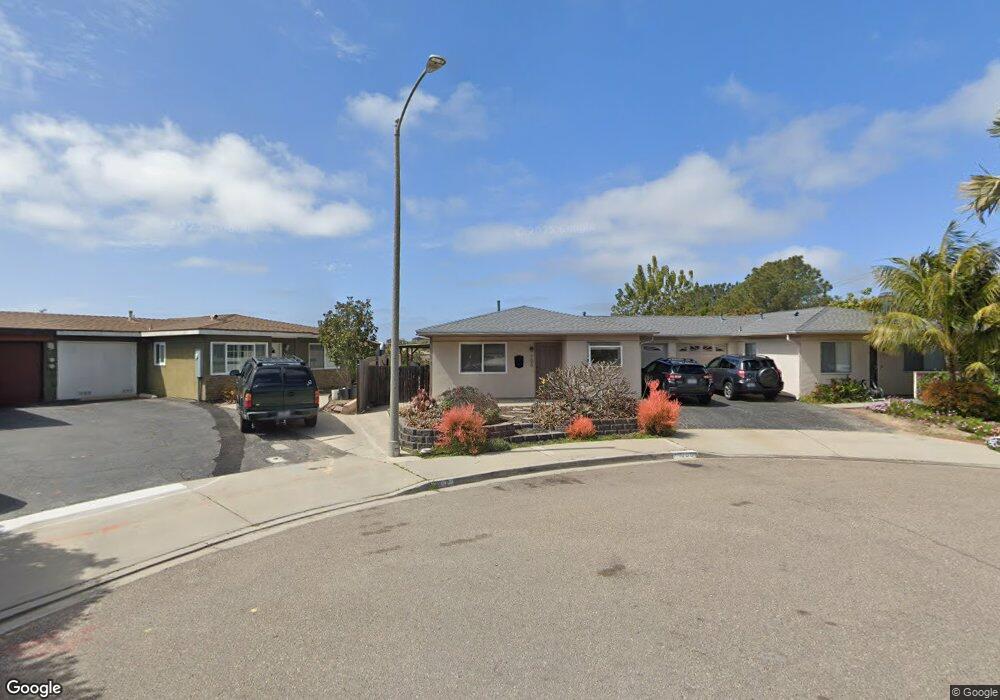
702 Snapdragon St Encinitas, CA 92024
Central Encinitas NeighborhoodEstimated Value: $999,541 - $1,217,000
3
Beds
2
Baths
1,091
Sq Ft
$1,020/Sq Ft
Est. Value
About This Home
This home is located at 702 Snapdragon St, Encinitas, CA 92024 and is currently estimated at $1,113,135, approximately $1,020 per square foot. 702 Snapdragon St is a home located in San Diego County with nearby schools including Park Dale Lane Elementary, Oak Crest Middle School, and La Costa Canyon High School.
Ownership History
Date
Name
Owned For
Owner Type
Purchase Details
Closed on
Feb 22, 2017
Sold by
Rotsheck Lois Norma
Bought by
Rotsheck Decedents Trust
Current Estimated Value
Purchase Details
Closed on
Dec 4, 2012
Sold by
General Rfe Llc
Bought by
Rotsheck Lois N
Purchase Details
Closed on
Feb 15, 2011
Sold by
Rotsheck Lois Norma
Bought by
General Rfe Llc
Purchase Details
Closed on
Aug 19, 2009
Sold by
General Ref Llc
Bought by
Rotsheck Paul Alton and Rotsheck Lois Norma
Purchase Details
Closed on
Jan 29, 2009
Sold by
Rotsheck Paul Alton and Rotsheck Lois Norma
Bought by
General Ref Llc
Purchase Details
Closed on
Sep 30, 2002
Sold by
Rotsheck Paul Alton
Bought by
Rotsheck Paul Alton and Rotsheck Lois Norma
Purchase Details
Closed on
May 12, 1997
Sold by
Rotsheck Margaret S
Bought by
Rotsheck Margaret S and Rotsheck Paul Alton
Create a Home Valuation Report for This Property
The Home Valuation Report is an in-depth analysis detailing your home's value as well as a comparison with similar homes in the area
Home Values in the Area
Average Home Value in this Area
Purchase History
| Date | Buyer | Sale Price | Title Company |
|---|---|---|---|
| Rotsheck Decedents Trust | -- | None Available | |
| Rotsheck Lois N | -- | Fidelity National Title Co | |
| General Rfe Llc | -- | None Available | |
| Rotsheck Paul Alton | -- | Accommodation | |
| General Ref Llc | -- | None Available | |
| Rotsheck Paul Alton | -- | -- | |
| Rotsheck Margaret S | -- | -- |
Source: Public Records
Tax History
| Year | Tax Paid | Tax Assessment Tax Assessment Total Assessment is a certain percentage of the fair market value that is determined by local assessors to be the total taxable value of land and additions on the property. | Land | Improvement |
|---|---|---|---|---|
| 2025 | $2,202 | $149,212 | $63,391 | $85,821 |
| 2024 | $2,202 | $146,288 | $62,149 | $84,139 |
| 2023 | $2,150 | $143,421 | $60,931 | $82,490 |
| 2022 | $2,215 | $140,610 | $59,737 | $80,873 |
| 2021 | $2,141 | $137,854 | $58,566 | $79,288 |
| 2020 | $2,131 | $136,441 | $57,966 | $78,475 |
| 2019 | $2,099 | $133,767 | $56,830 | $76,937 |
| 2018 | $2,050 | $131,145 | $55,716 | $75,429 |
| 2017 | $2,084 | $128,574 | $54,624 | $73,950 |
| 2016 | $2,110 | $126,053 | $53,553 | $72,500 |
| 2015 | $2,131 | $124,160 | $52,749 | $71,411 |
| 2014 | $2,047 | $121,729 | $51,716 | $70,013 |
Source: Public Records
Map
Nearby Homes
- 731 Teaberry St Unit 4
- 800 Encinitas Blvd Unit 104
- 548 Quail Pointe Ln
- 155 Rosebay Dr Unit 42
- 271 Coneflower St
- 935 Encinitas Blvd
- 664 Sea Ridge Ct
- 634 Shasta Dr
- 598 Paloma Ct
- 760 Bonita Dr
- 103 Mangano Cir
- 407 Requeza St Unit E9
- 623 Quail Gardens Ln
- 554 & 556 Stratford Dr
- 537 Sweet Pea Place
- 1009 Arcadia Rd
- 370 Carmel Creeper Place Unit 8
- 444 N El Camino Real Unit 47
- 444 N El Camino Real Unit 48
- 444 N El Camino Real Unit SPC 42
- 700 Snapdragon St
- 707 Snapdragon St
- 709 Snapdragon St
- 708 Snapdragon St
- 706 Snapdragon St
- 797 Mays Hollow Ln
- 713 Snapdragon St
- 715 Snapdragon St
- 712 Snapdragon St
- 714 Snapdragon St
- 706 Teaberry St
- 708 Teaberry St
- 719 Snapdragon St
- 721 Snapdragon St
- 703 Sunflower St
- 705 Sunflower St
- 712 Teaberry St
- 714 Teaberry St
- 720 Snapdragon St
- 718 Snapdragon St
Your Personal Tour Guide
Ask me questions while you tour the home.