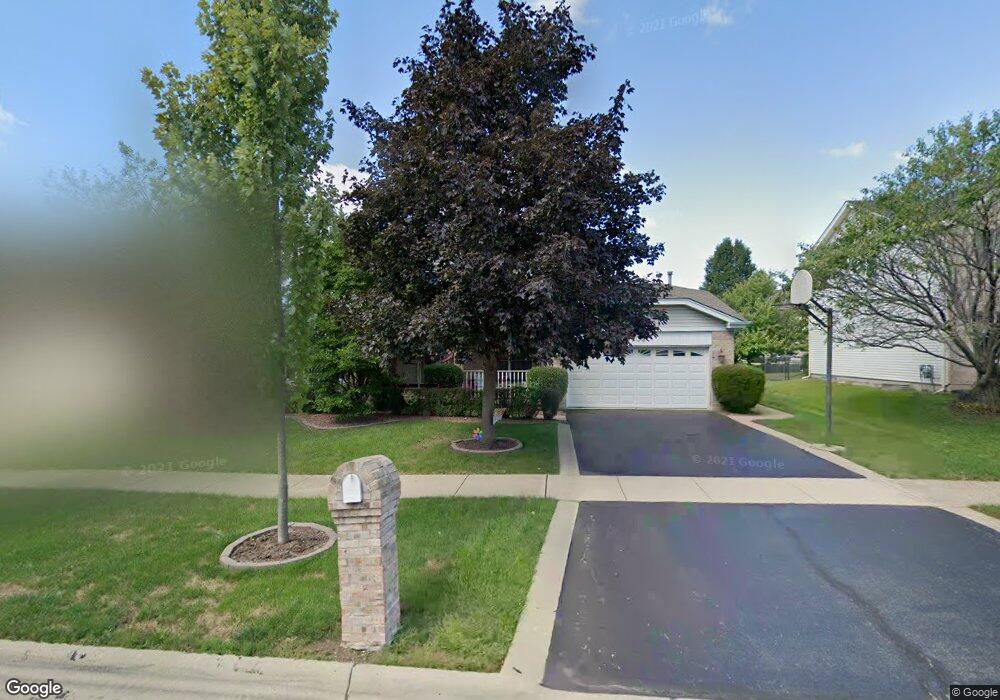
702 Stuart Dr Carol Stream, IL 60188
Estimated Value: $516,000 - $563,000
5
Beds
3
Baths
2,571
Sq Ft
$209/Sq Ft
Est. Value
About This Home
This home is located at 702 Stuart Dr, Carol Stream, IL 60188 and is currently estimated at $537,859, approximately $209 per square foot. 702 Stuart Dr is a home located in DuPage County with nearby schools including Roy De Shane Elementary School, Stratford Middle School, and Glenbard North High School.
Ownership History
Date
Name
Owned For
Owner Type
Purchase Details
Closed on
Jul 5, 2011
Sold by
Camp Christopher and Camp Caryn
Bought by
Cisko Jeffrey and Cisko Christina
Current Estimated Value
Home Financials for this Owner
Home Financials are based on the most recent Mortgage that was taken out on this home.
Original Mortgage
$280,000
Outstanding Balance
$193,086
Interest Rate
4.56%
Mortgage Type
New Conventional
Estimated Equity
$344,773
Purchase Details
Closed on
Mar 17, 2005
Sold by
Gagliardi Mark F and Gagliardi Gina M
Bought by
Camp Christopher and Lobodzinski Caryn
Home Financials for this Owner
Home Financials are based on the most recent Mortgage that was taken out on this home.
Original Mortgage
$300,000
Interest Rate
5.71%
Mortgage Type
Purchase Money Mortgage
Create a Home Valuation Report for This Property
The Home Valuation Report is an in-depth analysis detailing your home's value as well as a comparison with similar homes in the area
Home Values in the Area
Average Home Value in this Area
Purchase History
| Date | Buyer | Sale Price | Title Company |
|---|---|---|---|
| Cisko Jeffrey | $334,000 | Fort Dearborn Land Title Llc | |
| Camp Christopher | $375,000 | Multiple |
Source: Public Records
Mortgage History
| Date | Status | Borrower | Loan Amount |
|---|---|---|---|
| Open | Cisko Jeffrey | $280,000 | |
| Previous Owner | Camp Christopher | $300,000 | |
| Closed | Camp Christopher | $37,500 |
Source: Public Records
Tax History
| Year | Tax Paid | Tax Assessment Tax Assessment Total Assessment is a certain percentage of the fair market value that is determined by local assessors to be the total taxable value of land and additions on the property. | Land | Improvement |
|---|---|---|---|---|
| 2024 | $12,337 | $151,810 | $32,925 | $118,885 |
| 2023 | $11,690 | $138,830 | $30,110 | $108,720 |
| 2022 | $11,758 | $133,460 | $29,910 | $103,550 |
| 2021 | $11,221 | $126,800 | $28,420 | $98,380 |
| 2020 | $10,495 | $117,880 | $27,730 | $90,150 |
| 2019 | $10,101 | $113,280 | $26,650 | $86,630 |
| 2018 | $11,363 | $128,310 | $25,950 | $102,360 |
| 2017 | $10,761 | $118,920 | $24,050 | $94,870 |
| 2016 | $10,209 | $110,060 | $22,260 | $87,800 |
| 2015 | $9,994 | $102,700 | $20,770 | $81,930 |
| 2014 | $8,861 | $90,180 | $18,240 | $71,940 |
| 2013 | $8,903 | $93,260 | $18,860 | $74,400 |
Source: Public Records
Map
Nearby Homes
- 545 Alton Ct Unit 273
- 514 Alton Ct Unit 2
- 848 Birchbark Trail
- 734 Colorado Ct Unit 734
- 454 Esselen Ct Unit 2
- 862 Omaha Ct
- 522 Apache Ln
- 552 Cochise Place
- 27W270 Jefferson St
- 813 Kansas St
- 992 Navajo St
- 403 Arrowhead Trail
- 27W046 North Ave
- 426 Thunderbird Trail
- 352 Sioux Ln
- 933 Columbia Ct
- 1430 Preserve Dr Unit 29
- 1N053 Lot 1 Farwell St
- 1N063 LOT 2 Farwell St
- 1N083 LOT 4 Farwell St
Your Personal Tour Guide
Ask me questions while you tour the home.