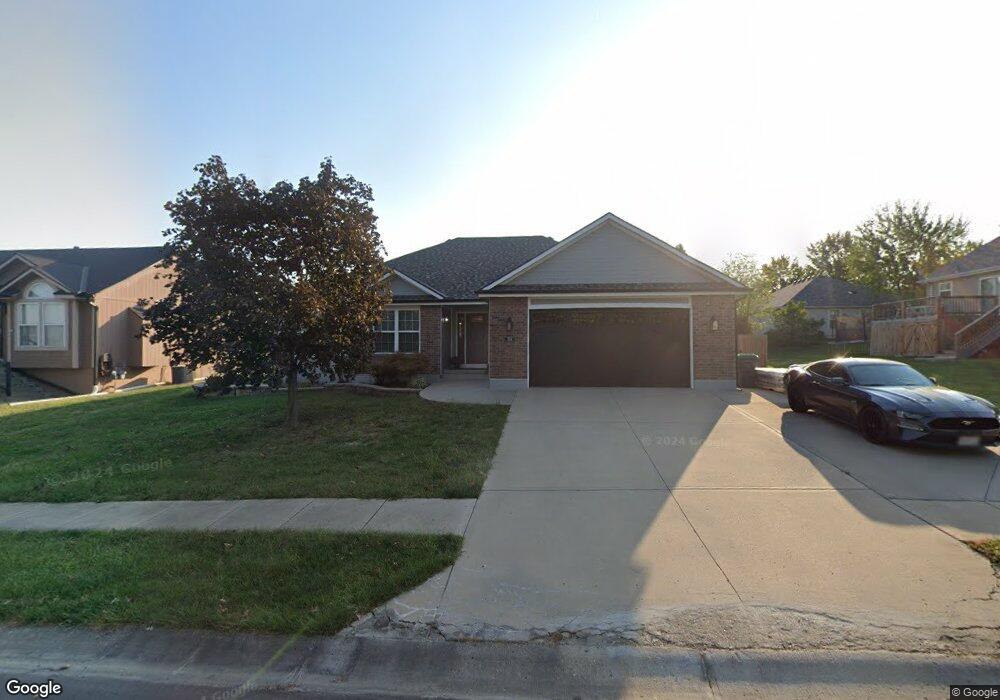
702 SW Ridgeview Dr Grain Valley, MO 64029
Estimated Value: $304,626 - $320,000
3
Beds
2
Baths
1,470
Sq Ft
$211/Sq Ft
Est. Value
About This Home
This home is located at 702 SW Ridgeview Dr, Grain Valley, MO 64029 and is currently estimated at $309,657, approximately $210 per square foot. 702 SW Ridgeview Dr is a home located in Jackson County with nearby schools including Grain Valley High School.
Ownership History
Date
Name
Owned For
Owner Type
Purchase Details
Closed on
Feb 26, 2010
Sold by
Dennis Robert L and Dennis Crystal E
Bought by
Burkert Eric R and Burkert Leslie M
Current Estimated Value
Home Financials for this Owner
Home Financials are based on the most recent Mortgage that was taken out on this home.
Original Mortgage
$166,106
Outstanding Balance
$109,383
Interest Rate
4.93%
Mortgage Type
FHA
Estimated Equity
$200,274
Purchase Details
Closed on
Aug 24, 2006
Sold by
Campbell Robert and Campbell Katie
Bought by
Dennis Robert L and Brown Crystal E
Purchase Details
Closed on
Jun 24, 2004
Sold by
Guffey Ronald D and Guffey Joy J
Bought by
Campbell Robert and Campbell Katie
Home Financials for this Owner
Home Financials are based on the most recent Mortgage that was taken out on this home.
Original Mortgage
$75,000
Interest Rate
6.3%
Mortgage Type
Purchase Money Mortgage
Create a Home Valuation Report for This Property
The Home Valuation Report is an in-depth analysis detailing your home's value as well as a comparison with similar homes in the area
Home Values in the Area
Average Home Value in this Area
Purchase History
| Date | Buyer | Sale Price | Title Company |
|---|---|---|---|
| Burkert Eric R | -- | Kansas City Title | |
| Dennis Robert L | -- | Heart Of America Title & Esc | |
| Campbell Robert | -- | Metro One |
Source: Public Records
Mortgage History
| Date | Status | Borrower | Loan Amount |
|---|---|---|---|
| Open | Burkert Eric R | $166,106 | |
| Previous Owner | Campbell Robert | $75,000 |
Source: Public Records
Tax History Compared to Growth
Tax History
| Year | Tax Paid | Tax Assessment Tax Assessment Total Assessment is a certain percentage of the fair market value that is determined by local assessors to be the total taxable value of land and additions on the property. | Land | Improvement |
|---|---|---|---|---|
| 2025 | $3,108 | $43,386 | $8,432 | $34,954 |
| 2024 | $2,991 | $37,728 | $5,394 | $32,334 |
| 2023 | $2,991 | $37,729 | $5,271 | $32,458 |
| 2022 | $3,273 | $36,100 | $4,262 | $31,838 |
| 2021 | $3,196 | $36,100 | $4,262 | $31,838 |
| 2020 | $4,998 | $36,098 | $4,262 | $31,836 |
| 2019 | $3,174 | $36,098 | $4,262 | $31,836 |
| 2018 | $2,956 | $31,417 | $3,709 | $27,708 |
| 2017 | $2,956 | $31,417 | $3,709 | $27,708 |
| 2016 | $2,907 | $30,911 | $4,968 | $25,943 |
| 2014 | $2,872 | $30,305 | $4,870 | $25,435 |
Source: Public Records
Map
Nearby Homes
- 601 SW Nelson Dr
- 621 SW Tisha Ln
- 808 SW Country Hill Dr
- 506 SW Meadowood Dr
- 836 SW Lee Ann Dr
- 709 SW Harvest Cir
- 725 SW Tisha Ln
- 501 SW Creek Ridge Dr
- 309 SW Creek Ridge Dr
- 1001 SW Cross Creek Dr
- 1010 SW Cross Creek Dr
- 913 SW Abar Dr
- 636 SW Lakeview Dr
- 1400 SW Cross Creek Dr
- 209 SW Cross Creek Dr
- 207 Pebblebrook St
- 800 SW Hilltop Ct
- 1026 SW Sandy Ln
- 115 E Old Us 40 Hwy N A
- 1024 Christie Ln
- 410 SW Crestview Dr
- 408 SW Crestview Dr
- 700 SW Ridgeview Dr
- 406 SW Crestview Dr
- 659 SW Crestview Dr
- 703 SW Ridgeview Dr
- 705 SW Ridgeview Dr
- 701 SW Ridgeview Dr
- 703 SW Logan Dr
- 609 SW Tisha Ln
- 409 SW Crestview Dr
- 404 SW Crestview Dr
- 617 SW Tisha Ln
- 613 SW Tisha Ln
- 707 SW Ridgeview Dr
- 605 SW Tisha Ln
- 709 SW Ridgeview Dr
- 405 SW Crestview Dr
- Lot 13 Crestview Dr