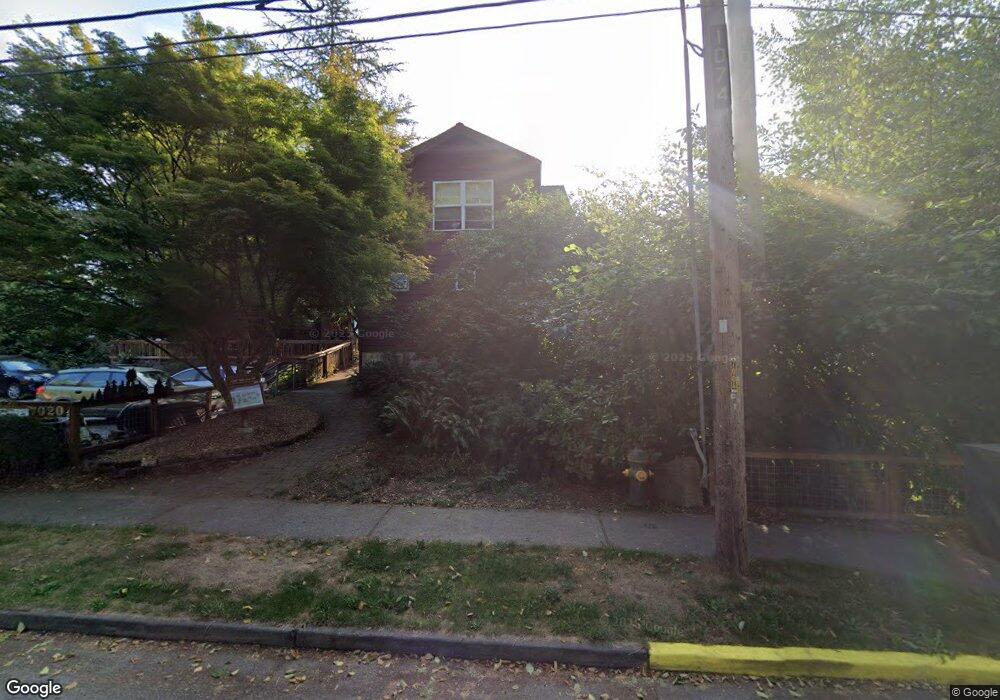
7020 18th Ave SW Unit F14 Seattle, WA 98106
Riverview NeighborhoodEstimated Value: $517,582 - $600,000
2
Beds
2
Baths
1,101
Sq Ft
$519/Sq Ft
Est. Value
About This Home
This home is located at 7020 18th Ave SW Unit F14, Seattle, WA 98106 and is currently estimated at $571,396, approximately $518 per square foot. 7020 18th Ave SW Unit F14 is a home located in King County with nearby schools including Sanislo Elementary School, Denny Middle School, and Chief Sealth High School.
Ownership History
Date
Name
Owned For
Owner Type
Purchase Details
Closed on
May 15, 2006
Sold by
Williamson Linda A and West Paul
Bought by
Faloona Brandon and Walsh Kristen
Current Estimated Value
Home Financials for this Owner
Home Financials are based on the most recent Mortgage that was taken out on this home.
Original Mortgage
$188,000
Outstanding Balance
$108,944
Interest Rate
6.41%
Estimated Equity
$462,452
Purchase Details
Closed on
Jan 7, 1998
Sold by
Israel Larry
Bought by
Williamson Linda A
Home Financials for this Owner
Home Financials are based on the most recent Mortgage that was taken out on this home.
Original Mortgage
$80,000
Interest Rate
7.14%
Purchase Details
Closed on
Jul 25, 1994
Sold by
Sunday Evening Cohousing Assn
Bought by
Israel Larry
Home Financials for this Owner
Home Financials are based on the most recent Mortgage that was taken out on this home.
Original Mortgage
$66,850
Interest Rate
8.38%
Create a Home Valuation Report for This Property
The Home Valuation Report is an in-depth analysis detailing your home's value as well as a comparison with similar homes in the area
Home Values in the Area
Average Home Value in this Area
Purchase History
| Date | Buyer | Sale Price | Title Company |
|---|---|---|---|
| Faloona Brandon | $235,000 | Commonwealth L | |
| Williamson Linda A | $106,500 | -- | |
| Israel Larry | $95,315 | Chicago Title Insurance Co |
Source: Public Records
Mortgage History
| Date | Status | Borrower | Loan Amount |
|---|---|---|---|
| Open | Faloona Brandon | $188,000 | |
| Previous Owner | Williamson Linda A | $80,000 | |
| Previous Owner | Israel Larry | $66,850 |
Source: Public Records
Tax History Compared to Growth
Tax History
| Year | Tax Paid | Tax Assessment Tax Assessment Total Assessment is a certain percentage of the fair market value that is determined by local assessors to be the total taxable value of land and additions on the property. | Land | Improvement |
|---|---|---|---|---|
| 2024 | $5,617 | $562,000 | $140,400 | $421,600 |
| 2023 | $5,095 | $615,000 | $140,400 | $474,600 |
| 2022 | $4,592 | $578,000 | $120,300 | $457,700 |
| 2021 | $3,836 | $477,000 | $80,200 | $396,800 |
| 2020 | $4,105 | $374,000 | $80,200 | $293,800 |
| 2018 | $2,960 | $362,000 | $60,100 | $301,900 |
| 2017 | $2,763 | $280,000 | $60,100 | $219,900 |
| 2016 | $2,586 | $271,000 | $44,100 | $226,900 |
| 2015 | $2,530 | $248,000 | $44,100 | $203,900 |
| 2014 | -- | $250,000 | $44,100 | $205,900 |
| 2013 | -- | $228,000 | $44,100 | $183,900 |
Source: Public Records
Map
Nearby Homes
- 7023 16th Ave SW
- 0 17th Ave SW
- 38 XX 21st Ave SW
- 6730 21st Ave SW
- 7169 18th Ave SW
- 6740 17th Ave SW
- 6968 24th Ave SW
- 7341 16th Ave SW
- 6705 Delridge Way SW
- 86 XX Delridge Way SW
- 7502 14th Ave SW
- 6737 25th Ave SW
- 1715 SW Graham St
- 1709 SW Graham St
- 2452 SW Webster St
- 7162 Shinkle Place SW Unit 64
- 2446 SW Webster St
- 2490 SW Webster St
- 2674 SW Sylvan Heights Dr
- 7749 17th Ave SW
- 7020 18th Ave SW Unit G15
- 7020 18th Ave SW Unit C7
- 7020 18th Ave SW Unit F12
- 7020 18th Ave SW Unit F13
- 7020 18th Ave SW Unit C6
- 7020 18th Ave SW Unit G16
- 7020 18th Ave SW Unit G17
- 7020 18th Ave SW Unit E11
- 7020 18th Ave SW Unit D8
- 7020 18th Ave SW Unit J22
- 7020 18th Ave SW Unit H19
- 7020 18th Ave SW Unit J21
- 7020 18th Ave SW Unit K23
- 7020 18th Ave SW Unit I20
- 7020 18th Ave SW Unit H18
- 7020 18th Ave SW Unit E10
- 7020 18th Ave SW Unit D9
- 7020 18th Ave SW Unit B5
- 7020 18th Ave SW Unit B4
- 7020 18th Ave SW Unit A3