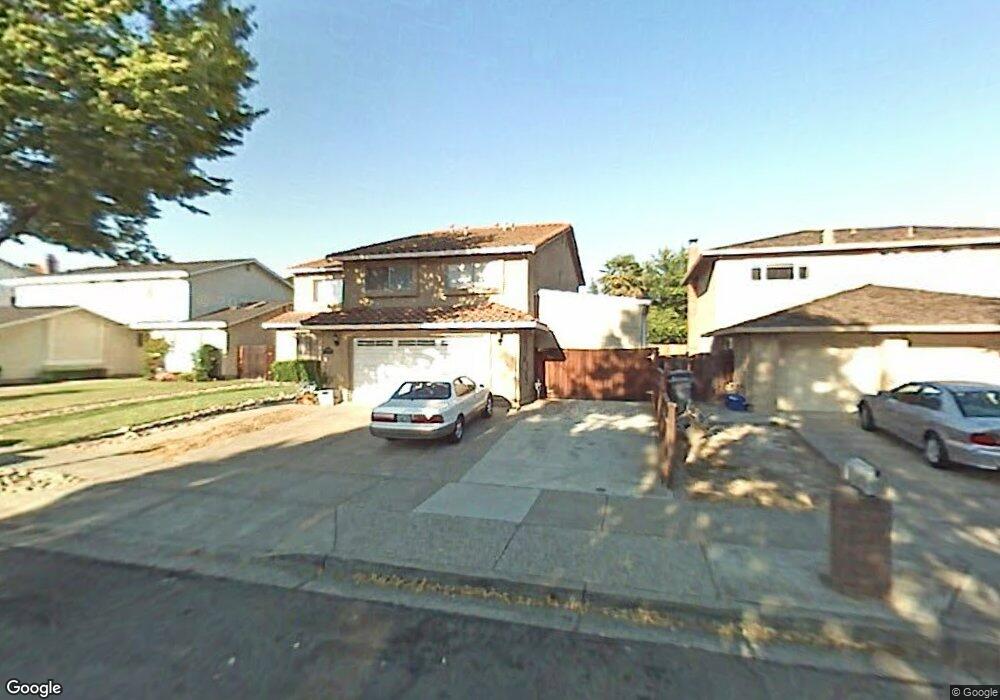
7020 Orchard Dr Gilroy, CA 95020
Estimated Value: $1,037,000 - $1,081,038
4
Beds
3
Baths
2,814
Sq Ft
$375/Sq Ft
Est. Value
About This Home
This home is located at 7020 Orchard Dr, Gilroy, CA 95020 and is currently estimated at $1,056,510, approximately $375 per square foot. 7020 Orchard Dr is a home located in Santa Clara County with nearby schools including Glen View Elementary School, Solorsano Middle School, and Gilroy High School.
Ownership History
Date
Name
Owned For
Owner Type
Purchase Details
Closed on
Jul 26, 2017
Sold by
Azevedo John R and Azevedo Linda A
Bought by
Azevedo John R and Azevedo Linda A
Current Estimated Value
Home Financials for this Owner
Home Financials are based on the most recent Mortgage that was taken out on this home.
Original Mortgage
$380,000
Interest Rate
3.88%
Mortgage Type
New Conventional
Purchase Details
Closed on
Jun 11, 2003
Sold by
Azevedo Linda A
Bought by
Azevedo John R and Azevedo Linda A
Purchase Details
Closed on
Apr 4, 2002
Sold by
Azevedo John Richard
Bought by
Azevedo Linda A
Home Financials for this Owner
Home Financials are based on the most recent Mortgage that was taken out on this home.
Original Mortgage
$375,000
Interest Rate
6.78%
Mortgage Type
Stand Alone First
Purchase Details
Closed on
Dec 14, 1998
Sold by
Robert Habenicht
Bought by
Habenicht Linda Smith and Smith Linda
Create a Home Valuation Report for This Property
The Home Valuation Report is an in-depth analysis detailing your home's value as well as a comparison with similar homes in the area
Home Values in the Area
Average Home Value in this Area
Purchase History
| Date | Buyer | Sale Price | Title Company |
|---|---|---|---|
| Azevedo John R | -- | First American Title Ins Co | |
| Azevedo John R | -- | -- | |
| Azevedo Linda A | -- | First American Title Guarant | |
| Azevedo Linda A | -- | First American Title Guarant | |
| Habenicht Linda Smith | -- | -- |
Source: Public Records
Mortgage History
| Date | Status | Borrower | Loan Amount |
|---|---|---|---|
| Closed | Azevedo John R | $380,000 | |
| Closed | Azevedo Linda A | $375,000 |
Source: Public Records
Tax History Compared to Growth
Tax History
| Year | Tax Paid | Tax Assessment Tax Assessment Total Assessment is a certain percentage of the fair market value that is determined by local assessors to be the total taxable value of land and additions on the property. | Land | Improvement |
|---|---|---|---|---|
| 2025 | $4,187 | $337,526 | $111,263 | $226,263 |
| 2024 | $4,187 | $330,909 | $109,082 | $221,827 |
| 2023 | $4,162 | $324,422 | $106,944 | $217,478 |
| 2022 | $4,093 | $318,062 | $104,848 | $213,214 |
| 2021 | $4,074 | $311,827 | $102,793 | $209,034 |
| 2020 | $4,029 | $308,630 | $101,739 | $206,891 |
| 2019 | $3,992 | $302,580 | $99,745 | $202,835 |
| 2018 | $3,731 | $296,648 | $97,790 | $198,858 |
| 2017 | $3,807 | $290,832 | $95,873 | $194,959 |
| 2016 | $3,725 | $285,131 | $93,994 | $191,137 |
| 2015 | $3,517 | $280,849 | $92,583 | $188,266 |
| 2014 | $3,495 | $275,349 | $90,770 | $184,579 |
Source: Public Records
Map
Nearby Homes
- 773 Gettysburg Way
- 775 Williamsburg Way Unit B
- 771 Williamsburg Way Unit C
- 895 Greenwich Dr
- 738 Gettysburg Way
- 7035 Yorktown Dr
- 7245 Trenton Place
- 7210 Yorktown Dr
- 500 W 10th St Unit 10
- 500 W 10th St Unit 29
- 500 W 10th St Unit 61
- 500 W 10th St Unit 73
- 7363 Ailes Ct Unit Homesite 5
- 7343 Princevalle St Unit Homesite 19
- 7352 Ailes Ct Unit Homesite 7
- Plan 2 at Heritage on 6th Street
- Plan 1 at Heritage on 6th Street
- 7351 Princevalle St Unit Homesite 18
- 7360 Ailes Ct Unit Homesite 8
- 7371 Ailes Ct Unit Homesite 4
- 7030 Orchard Dr
- 7010 Orchard Dr
- 7025 Valley Forge Dr
- 7015 Valley Forge Dr
- 7040 Orchard Dr
- 7035 Valley Forge Dr
- 661671 Fairview Dr
- 860 Greenwich Dr
- 7045 Valley Forge Dr
- 7050 Orchard Dr
- 865 Greenwich Dr
- 870 Greenwich Dr
- 7060 Orchard Dr
- 875 Greenwich Dr
- 850 Chesapeake Place
- 7020 Valley Forge Dr
- 7010 Valley Forge Dr
- 7030 Valley Forge Dr
- 7040 Valley Forge Dr
- 880 Greenwich Dr