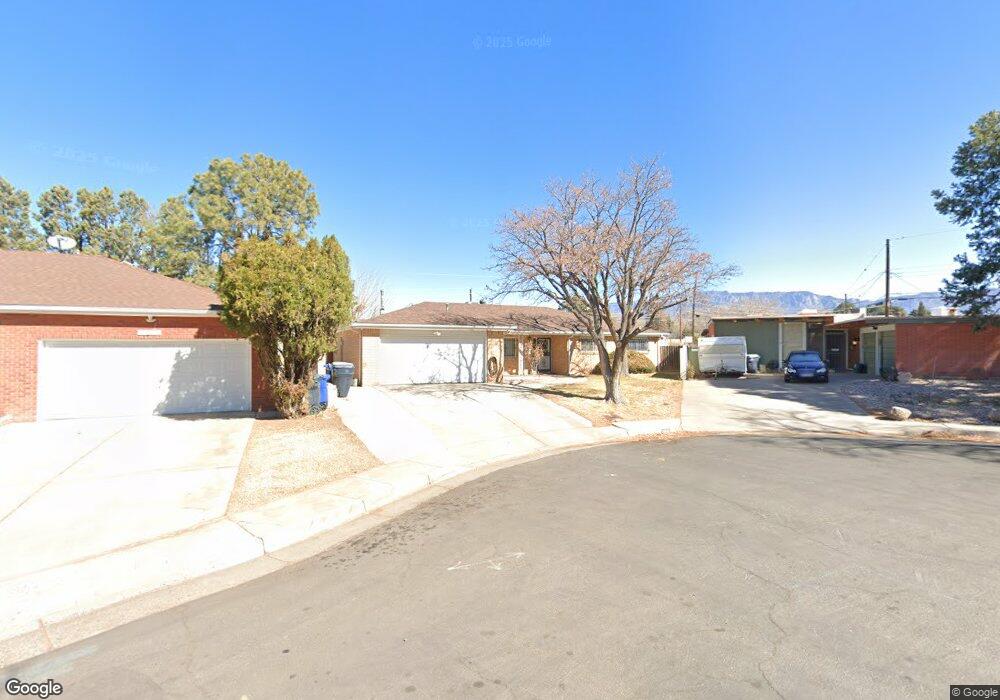
7021 Las Vegas Ave NE Albuquerque, NM 87110
Uptown NeighborhoodEstimated Value: $370,000 - $510,000
4
Beds
2
Baths
2,348
Sq Ft
$182/Sq Ft
Est. Value
About This Home
This home is located at 7021 Las Vegas Ave NE, Albuquerque, NM 87110 and is currently estimated at $427,835, approximately $182 per square foot. 7021 Las Vegas Ave NE is a home located in Bernalillo County with nearby schools including Zuni Elementary School, Cleveland Middle School, and Sandia High School.
Ownership History
Date
Name
Owned For
Owner Type
Purchase Details
Closed on
Jul 11, 2019
Sold by
Johnson Janelle K
Bought by
Gross Robert D
Current Estimated Value
Home Financials for this Owner
Home Financials are based on the most recent Mortgage that was taken out on this home.
Original Mortgage
$260,300
Outstanding Balance
$227,556
Interest Rate
3.82%
Mortgage Type
New Conventional
Estimated Equity
$200,279
Purchase Details
Closed on
Feb 25, 2016
Sold by
Chouinard Mark and Chouinard Virginia G
Bought by
Gross Robert D and Johnson Janelle K
Home Financials for this Owner
Home Financials are based on the most recent Mortgage that was taken out on this home.
Original Mortgage
$242,526
Interest Rate
3.87%
Mortgage Type
FHA
Purchase Details
Closed on
Sep 1, 2010
Sold by
Chouinard Virginia G
Bought by
Chouinard Mark and Chouinard Virginia G
Purchase Details
Closed on
Aug 30, 2006
Sold by
Ashby Lawrence E and Ashby Jeanette M
Bought by
Chouinard Virginia G
Home Financials for this Owner
Home Financials are based on the most recent Mortgage that was taken out on this home.
Original Mortgage
$221,600
Interest Rate
6.79%
Mortgage Type
Purchase Money Mortgage
Create a Home Valuation Report for This Property
The Home Valuation Report is an in-depth analysis detailing your home's value as well as a comparison with similar homes in the area
Home Values in the Area
Average Home Value in this Area
Purchase History
| Date | Buyer | Sale Price | Title Company |
|---|---|---|---|
| Gross Robert D | -- | Fidelity National Ttl Ins Co | |
| Gross Robert D | -- | Fidelity National Title Of N | |
| Chouinard Mark | -- | Stewart Title | |
| Chouinard Virginia G | -- | Fidelity Natl Title Ins Co |
Source: Public Records
Mortgage History
| Date | Status | Borrower | Loan Amount |
|---|---|---|---|
| Open | Gross Robert D | $260,300 | |
| Previous Owner | Gross Robert D | $242,526 | |
| Previous Owner | Chouinard Virginia G | $221,600 |
Source: Public Records
Tax History Compared to Growth
Tax History
| Year | Tax Paid | Tax Assessment Tax Assessment Total Assessment is a certain percentage of the fair market value that is determined by local assessors to be the total taxable value of land and additions on the property. | Land | Improvement |
|---|---|---|---|---|
| 2025 | $3,551 | $88,752 | $16,382 | $72,370 |
| 2024 | $3,551 | $86,167 | $15,905 | $70,262 |
| 2023 | $3,490 | $83,658 | $15,442 | $68,216 |
| 2022 | $3,370 | $81,222 | $14,993 | $66,229 |
| 2021 | $3,254 | $78,856 | $14,556 | $64,300 |
| 2020 | $3,198 | $76,559 | $14,132 | $62,427 |
| 2019 | $3,199 | $76,592 | $14,132 | $62,460 |
| 2018 | $3,206 | $76,592 | $14,132 | $62,460 |
| 2017 | $3,201 | $77,259 | $14,132 | $63,127 |
| 2016 | $2,934 | $68,954 | $16,295 | $52,659 |
| 2015 | $66,947 | $66,947 | $15,821 | $51,126 |
| 2014 | -- | $64,997 | $15,360 | $49,637 |
| 2013 | -- | $63,104 | $14,913 | $48,191 |
Source: Public Records
Map
Nearby Homes
- 7029 Veranda Rd NE
- 3105 Dallas St NE
- 3109 Dallas St NE
- 3108 Dallas St NE
- 2908 Pennsylvania St NE
- 2916 Indiana St NE
- 2732 Kentucky St NE
- 2816 Indiana St NE
- 7101 Aztec Rd NE
- 2829 Indiana St NE
- 2724 Pennsylvania St NE
- 2720 Pennsylvania St NE
- 2824 Texas St NE
- 2936 Carolina St NE
- 2720 Dakota St NE
- 3101 Vermont St NE
- 2627 Dakota St NE
- 2424 Louisiana Blvd NE Unit 403
- 8205 Connecticut St NE
- 7001 Edwina Ave NE
- 7025 Las Vegas Ave NE
- 7017 Las Vegas Ave NE
- 2920 Mesilla St NE
- 2929 Espanola St NE
- 7013 Las Vegas Ave NE
- 2925 Espanola St NE
- 7016 Las Vegas Ave NE
- 7106 Seminole Rd NE
- 2921 Espanola St NE
- 7112 Seminole Rd NE
- 2916 Mesilla St NE
- 7100 Seminole Rd NE
- 7009 Las Vegas Ave NE
- 7118 Seminole Rd NE
- 2917 Espanola St NE
- 2920 Las Cruces Rd NE
- 2920 Las Cruces St
- 2917 Mesilla St NE
- 2912 Mesilla St NE
- 7012 Seminole Rd NE