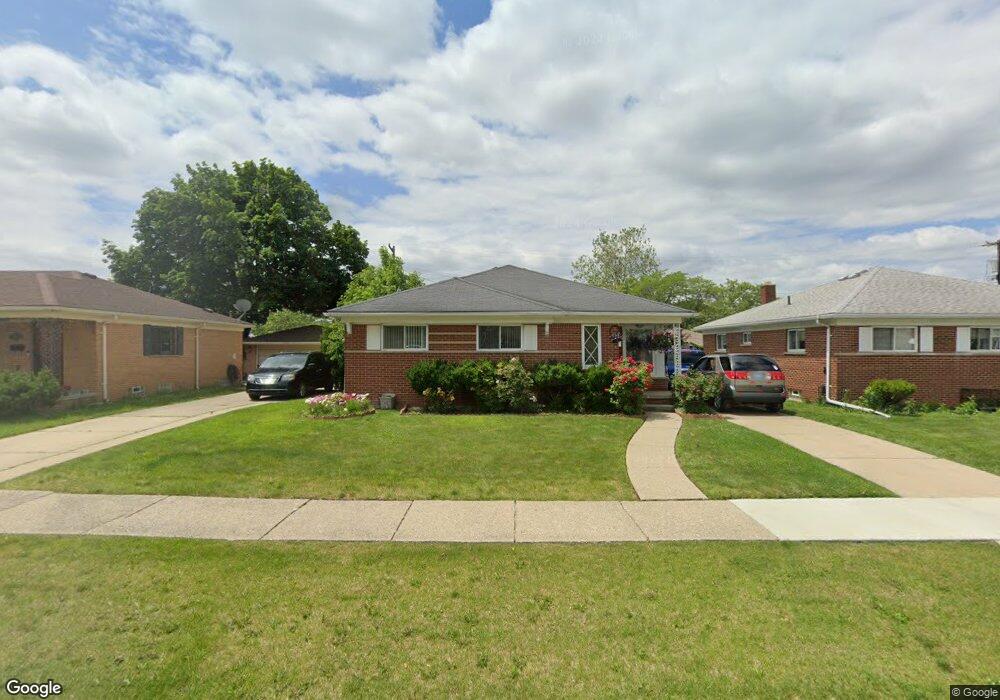
7023 N Charlesworth St Dearborn Heights, MI 48127
Estimated Value: $282,000 - $310,000
3
Beds
2
Baths
1,200
Sq Ft
$247/Sq Ft
Est. Value
About This Home
This home is located at 7023 N Charlesworth St, Dearborn Heights, MI 48127 and is currently estimated at $296,848, approximately $247 per square foot. 7023 N Charlesworth St is a home located in Wayne County with nearby schools including Crestwood High School, Riverside Middle School, and Kinloch Elementary School.
Ownership History
Date
Name
Owned For
Owner Type
Purchase Details
Closed on
May 10, 2023
Sold by
Al-Hachami Jalal
Bought by
Al-Hachami Jalal
Current Estimated Value
Home Financials for this Owner
Home Financials are based on the most recent Mortgage that was taken out on this home.
Original Mortgage
$162,000
Outstanding Balance
$151,846
Interest Rate
6.32%
Mortgage Type
New Conventional
Estimated Equity
$145,002
Purchase Details
Closed on
May 28, 2021
Sold by
Almacham Nahlah
Bought by
Alhacham Jalal
Purchase Details
Closed on
May 21, 2021
Sold by
Felstow Mary Lou and Felstow Alvan H
Bought by
Al Hacham Nahlah
Purchase Details
Closed on
Nov 22, 2016
Sold by
Felstow Alvan H and Felstow Mary Lou
Bought by
Al Hacham Nahlah
Purchase Details
Closed on
Jun 12, 2009
Sold by
Felstow Alvan H and Felstow Mary
Bought by
Felstow Alvan H
Create a Home Valuation Report for This Property
The Home Valuation Report is an in-depth analysis detailing your home's value as well as a comparison with similar homes in the area
Home Values in the Area
Average Home Value in this Area
Purchase History
| Date | Buyer | Sale Price | Title Company |
|---|---|---|---|
| Al-Hachami Jalal | -- | None Listed On Document | |
| Alhacham Jalal | -- | None Available | |
| Al Hacham Nahlah | $134,000 | None Available | |
| Al Hacham Nahlah | -- | None Available | |
| Felstow Alvan H | -- | None Available |
Source: Public Records
Mortgage History
| Date | Status | Borrower | Loan Amount |
|---|---|---|---|
| Open | Al-Hachami Jalal | $162,000 | |
| Closed | Al Hacham Nahlah | $0 |
Source: Public Records
Tax History Compared to Growth
Tax History
| Year | Tax Paid | Tax Assessment Tax Assessment Total Assessment is a certain percentage of the fair market value that is determined by local assessors to be the total taxable value of land and additions on the property. | Land | Improvement |
|---|---|---|---|---|
| 2025 | $5,011 | $124,000 | $0 | $0 |
| 2024 | $5,011 | $114,700 | $0 | $0 |
| 2023 | $2,442 | $95,900 | $0 | $0 |
| 2022 | $3,307 | $83,800 | $0 | $0 |
| 2021 | $3,316 | $77,300 | $0 | $0 |
| 2019 | $3,227 | $67,700 | $0 | $0 |
| 2018 | $2,229 | $62,200 | $0 | $0 |
| 2017 | $1,855 | $60,600 | $0 | $0 |
| 2016 | $2,563 | $52,300 | $0 | $0 |
| 2015 | $3,678 | $48,900 | $0 | $0 |
| 2013 | $3,564 | $37,900 | $0 | $0 |
| 2010 | -- | $45,900 | $0 | $0 |
Source: Public Records
Map
Nearby Homes
- 26511 W Warren St
- 6701 Rosemary St
- 7241 Lucerne St
- 7370 Amboy St
- 6735 Norborne Ave
- 7139 Centralia St
- 7350 N Inkster Rd Unit 17
- 7350 N Inkster Rd
- 6125 Ardmore
- 6804 Centralia St
- 6905 N Beech Daly Rd
- 6453 Centralia St
- 6435 Centralia St
- 6431 Centralia St
- 27517 Windsor St
- 6062 Plainfield St
- 27023 Clairview Dr
- 27418 Maplewood St
- 7029 Belton St
- 27047 Clairview Dr
- 7001 N Charlesworth St
- 7035 N Charlesworth St
- 7047 N Charlesworth St
- 6959 N Charlesworth St
- 6942 Rosemary St
- 6930 Rosemary St
- 6954 Rosemary St
- 6947 N Charlesworth St
- 7059 N Charlesworth St
- 6966 Rosemary St
- 6918 Rosemary St
- 7022 N Charlesworth St
- 7034 N Charlesworth St
- 7010 N Charlesworth St
- 7046 N Charlesworth St
- 7000 N Charlesworth St
- 7008 Rosemary St
- 7071 N Charlesworth St
- 6906 Rosemary St
- 7060 N Charlesworth St