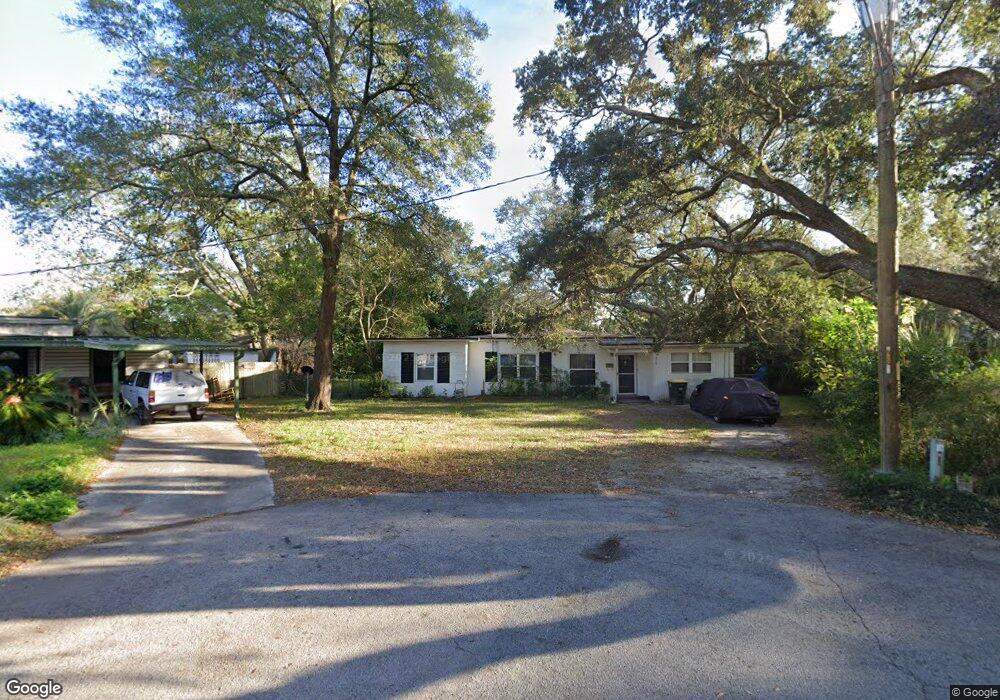
7026 Abbot Ct Jacksonville, FL 32216
Grove Park NeighborhoodEstimated Value: $271,000 - $338,000
3
Beds
2
Baths
1,848
Sq Ft
$161/Sq Ft
Est. Value
About This Home
This home is located at 7026 Abbot Ct, Jacksonville, FL 32216 and is currently estimated at $296,879, approximately $160 per square foot. 7026 Abbot Ct is a home located in Duval County with nearby schools including Holiday Hill Elementary School, Arlington Middle School, and Englewood High School.
Ownership History
Date
Name
Owned For
Owner Type
Purchase Details
Closed on
Aug 4, 2017
Sold by
Walker Faye W
Bought by
Walker Faye W and Frederick Vicent
Current Estimated Value
Purchase Details
Closed on
Apr 12, 1996
Sold by
Williams Merrill F and Williams Talitha S
Bought by
Walker Faye W
Home Financials for this Owner
Home Financials are based on the most recent Mortgage that was taken out on this home.
Original Mortgage
$50,000
Outstanding Balance
$2,356
Interest Rate
7.36%
Estimated Equity
$294,523
Create a Home Valuation Report for This Property
The Home Valuation Report is an in-depth analysis detailing your home's value as well as a comparison with similar homes in the area
Home Values in the Area
Average Home Value in this Area
Purchase History
| Date | Buyer | Sale Price | Title Company |
|---|---|---|---|
| Walker Faye W | -- | Attorney | |
| Walker Faye W | $64,000 | -- |
Source: Public Records
Mortgage History
| Date | Status | Borrower | Loan Amount |
|---|---|---|---|
| Open | Walker Faye W | $50,000 |
Source: Public Records
Tax History Compared to Growth
Tax History
| Year | Tax Paid | Tax Assessment Tax Assessment Total Assessment is a certain percentage of the fair market value that is determined by local assessors to be the total taxable value of land and additions on the property. | Land | Improvement |
|---|---|---|---|---|
| 2025 | $3,813 | $209,146 | $60,450 | $148,696 |
| 2024 | $3,813 | $209,524 | $60,450 | $149,074 |
| 2023 | $3,619 | $208,559 | $58,436 | $150,123 |
| 2022 | $3,198 | $201,446 | $58,436 | $143,010 |
| 2021 | $2,805 | $148,154 | $42,316 | $105,838 |
| 2020 | $1,000 | $86,403 | $0 | $0 |
| 2019 | $981 | $84,461 | $0 | $0 |
| 2018 | $962 | $82,887 | $0 | $0 |
| 2017 | $942 | $81,183 | $0 | $0 |
| 2016 | $930 | $79,514 | $0 | $0 |
| 2015 | $937 | $78,962 | $0 | $0 |
| 2014 | $936 | $78,336 | $0 | $0 |
Source: Public Records
Map
Nearby Homes