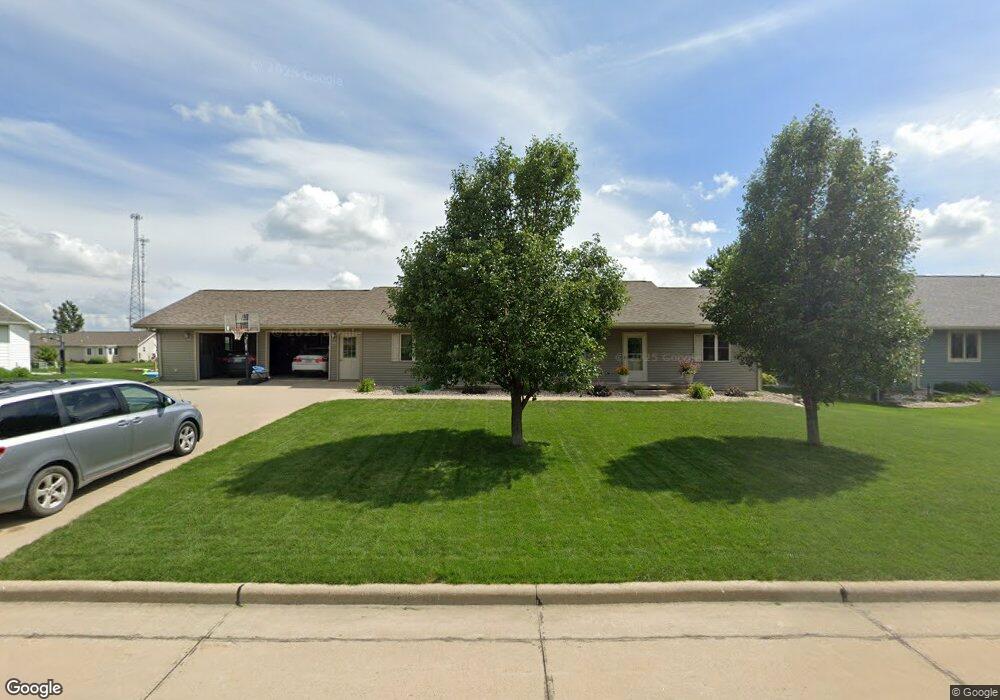
703 E 3rd St Sanborn, IA 51248
Estimated Value: $304,000 - $355,000
5
Beds
3
Baths
1,680
Sq Ft
$201/Sq Ft
Est. Value
About This Home
This home is located at 703 E 3rd St, Sanborn, IA 51248 and is currently estimated at $337,457, approximately $200 per square foot. 703 E 3rd St is a home located in O'Brien County with nearby schools including Hartley-Melvin-Sanborn Elementary School, Hartley-Melvin-Sanborn Middle School, and Hartley-Melvin-Sanborn High School.
Ownership History
Date
Name
Owned For
Owner Type
Purchase Details
Closed on
Jun 13, 2008
Sold by
Midwest Farmers Cooperative
Bought by
Minderhoud Anthony P and Minderhoud Wendi J
Current Estimated Value
Home Financials for this Owner
Home Financials are based on the most recent Mortgage that was taken out on this home.
Original Mortgage
$127,000
Outstanding Balance
$81,454
Interest Rate
6.04%
Mortgage Type
New Conventional
Estimated Equity
$256,003
Create a Home Valuation Report for This Property
The Home Valuation Report is an in-depth analysis detailing your home's value as well as a comparison with similar homes in the area
Purchase History
| Date | Buyer | Sale Price | Title Company |
|---|---|---|---|
| Minderhoud Anthony P | $176,000 | None Available |
Source: Public Records
Mortgage History
| Date | Status | Borrower | Loan Amount |
|---|---|---|---|
| Open | Minderhoud Anthony P | $127,000 |
Source: Public Records
Tax History
| Year | Tax Paid | Tax Assessment Tax Assessment Total Assessment is a certain percentage of the fair market value that is determined by local assessors to be the total taxable value of land and additions on the property. | Land | Improvement |
|---|---|---|---|---|
| 2025 | $3,714 | $327,480 | $32,830 | $294,650 |
| 2024 | $3,714 | $270,360 | $32,830 | $237,530 |
| 2023 | $3,610 | $270,360 | $32,830 | $237,530 |
| 2022 | $3,596 | $230,100 | $28,310 | $201,790 |
| 2021 | $3,596 | $230,100 | $28,310 | $201,790 |
| 2020 | $3,256 | $192,950 | $11,320 | $181,630 |
| 2019 | $3,192 | $185,670 | $0 | $0 |
| 2018 | $3,140 | $185,670 | $0 | $0 |
| 2017 | $3,140 | $180,290 | $0 | $0 |
| 2016 | $3,108 | $180,290 | $0 | $0 |
| 2015 | $3,140 | $169,730 | $0 | $0 |
| 2014 | $3,036 | $169,730 | $0 | $0 |
Source: Public Records
Map
Nearby Homes
- 602 E 3rd St
- 515 Sunrise Ave
- 501 Joyce St
- 310 W 3rd St
- 503 W 4th St
- 609 Walnut St
- 503 Shay Ave
- 5418 320th St
- 380 N Albright Ave
- 360 N Albright Ave
- 309 Iowa St
- 307 Harriman Ave
- 403 Fletcher Ave
- 655 S Mccormack Ave
- 20 S 2nd Ave W
- 22 W Maple Dr
- 0 0005042400 Unit 826180
- 10 S 1st Ave E
- 750 Larkspur Way
- 3099B Nest Ave
Your Personal Tour Guide
Ask me questions while you tour the home.