Estimated Value: $138,000 - $154,000
3
Beds
1
Bath
1,232
Sq Ft
$119/Sq Ft
Est. Value
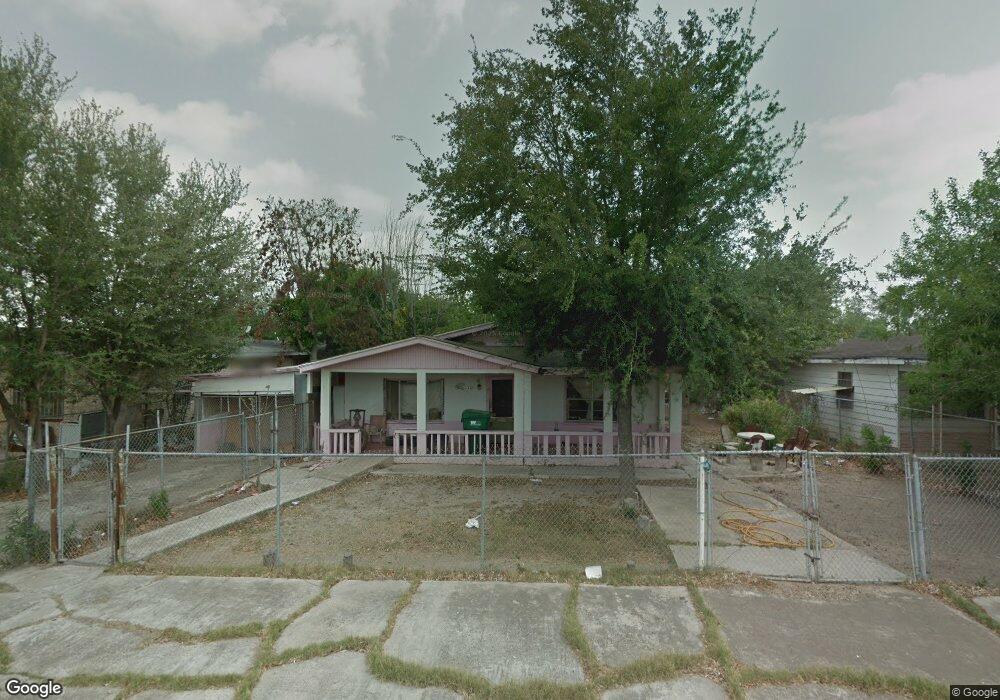
About This Home
This home is located at 703 E San Antonio Ave, Pharr, TX 78577 and is currently estimated at $146,012, approximately $118 per square foot. 703 E San Antonio Ave is a home located in Hidalgo County with nearby schools including Henry Ford Elementary, Liberty Middle School, and PSJA North Early College High School.
Ownership History
Date
Name
Owned For
Owner Type
Purchase Details
Closed on
Nov 21, 2023
Sold by
Karle Fred G
Bought by
Fashion Time Veracruz Llc
Current Estimated Value
Purchase Details
Closed on
Oct 3, 2023
Sold by
Kupish Laura
Bought by
Karle Fred G
Purchase Details
Closed on
Apr 15, 2022
Sold by
Karle Fred G
Bought by
Aramberri Victor M Garcia
Home Financials for this Owner
Home Financials are based on the most recent Mortgage that was taken out on this home.
Original Mortgage
$64,796
Interest Rate
5.1%
Mortgage Type
Seller Take Back
Purchase Details
Closed on
Jan 7, 2022
Sold by
Clerk Of The District Court In And For H
Bought by
Dm4 Realty Investments Llc
Purchase Details
Closed on
Jan 21, 2021
Sold by
Dm4 Realty Investments Llc
Bought by
Karle Fred G
Create a Home Valuation Report for This Property
The Home Valuation Report is an in-depth analysis detailing your home's value as well as a comparison with similar homes in the area
Home Values in the Area
Average Home Value in this Area
Purchase History
We collect this data history from publicly available records. To have your information removed, we recommend requesting removal directly through your county’s website.
| Date | Buyer | Sale Price | Title Company |
|---|---|---|---|
| Fashion Time Veracruz Llc | -- | Corporation Service | |
| Karle Fred G | -- | Corporation Service | |
| Aramberri Victor M Garcia | -- | Corporation Service | |
| Dm4 Realty Investments Llc | $41,453 | Linebarger Goggan Blair & Samp | |
| Karle Fred G | -- | None Listed On Document |
Source: Public Records
Mortgage History
We collect this data history from publicly available records. To have your information removed, we recommend requesting removal directly through your county’s website.
| Date | Status | Borrower | Loan Amount |
|---|---|---|---|
| Previous Owner | Aramberri Victor M Garcia | $64,796 |
Source: Public Records
Tax History
| Year | Tax Paid | Tax Assessment Tax Assessment Total Assessment is a certain percentage of the fair market value that is determined by local assessors to be the total taxable value of land and additions on the property. | Land | Improvement |
|---|---|---|---|---|
| 2025 | $2,416 | $134,646 | $53,813 | $80,833 |
| 2024 | $2,416 | $90,071 | $43,050 | $47,021 |
| 2023 | $2,414 | $90,071 | $43,050 | $47,021 |
| 2022 | $2,080 | $74,154 | $24,150 | $50,004 |
| 2021 | $1,854 | $64,891 | $24,150 | $40,741 |
| 2020 | $1,531 | $52,926 | $24,150 | $28,776 |
| 2019 | $1,305 | $44,543 | $21,000 | $23,543 |
| 2018 | $1,313 | $44,543 | $21,000 | $23,543 |
| 2017 | $1,324 | $44,543 | $21,000 | $23,543 |
| 2016 | $1,252 | $42,108 | $19,600 | $22,508 |
| 2015 | $1,042 | $42,108 | $19,600 | $22,508 |
Source: Public Records
Map
Nearby Homes
- 1013 E San Antonio Ave
- 504 E Chapa Ave
- 304 & 306 E Polk Ave
- 920 E Kathy St
- 600 E Bell Ave
- 520 E Hawk Ave
- 809 E Ferguson St
- 811 E Sanchez St
- 00 E Ferguson Ave
- 1220 E Lucas Ave
- 1218 E Alan St
- 0 Ferguson Ave Unit 394023
- 310 E Hawk Ave
- 407 N Veterans Blvd
- 1220 E Alan St
- 1400 N Veterans Blvd
- 214 E Clark Ave
- 706 Ebony St
- 1214 E Sanchez St
- 5704 N Ebony St
- 707 E San Antonio Ave
- 701 E San Antonio Ave
- 1102 N Fir St
- 708 E Polk Ave
- 704 E Polk Ave
- 1100 N Fir St
- 801 E San Antonio Ave
- 704 E San Antonio Ave
- 706 E San Antonio Ave
- 702 E San Antonio Ave
- 1106 N Fir St
- 708 E San Antonio Ave
- 802 E Polk Ave
- 1010 N Fir St
- 802 E San Antonio Ave
- 806 E Polk Ave
- 1008 N Fir St
- 806 E San Antonio Ave
- 809 E San Antonio Ave
- 713 E Cortez Ave
Your Personal Tour Guide
Ask me questions while you tour the home.