Estimated Value: $96,844 - $117,000
3
Beds
1
Bath
1,636
Sq Ft
$64/Sq Ft
Est. Value
About This Home
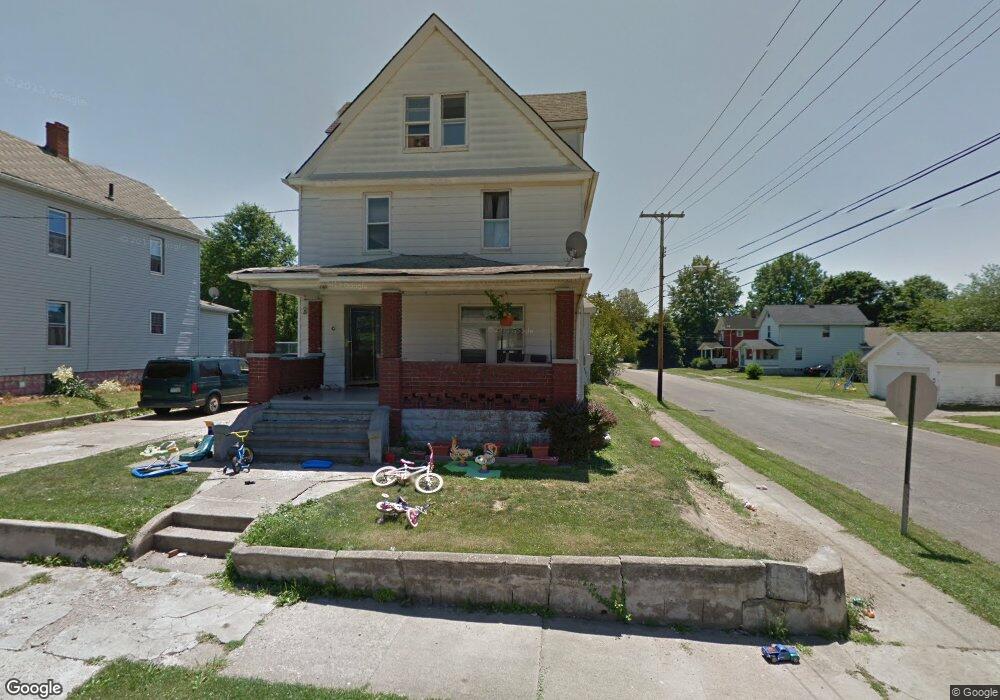
This home is located at 703 Fenton St, Niles, OH 44446 and is currently estimated at $104,711, approximately $64 per square foot. 703 Fenton St is a home located in Trumbull County with nearby schools including Niles Primary School, Niles Intermediate School, and Niles Middle School.
Ownership History
Date
Name
Owned For
Owner Type
Purchase Details
Closed on
Feb 26, 2007
Sold by
Russo Neil
Bought by
Hall Jeremy J and Taylor Jennifer
Current Estimated Value
Home Financials for this Owner
Home Financials are based on the most recent Mortgage that was taken out on this home.
Original Mortgage
$53,531
Outstanding Balance
$32,348
Interest Rate
6.23%
Mortgage Type
FHA
Estimated Equity
$72,363
Purchase Details
Closed on
Feb 19, 2007
Sold by
Russo Neil
Bought by
Hall Jeremy J and Taylor Jennifer
Home Financials for this Owner
Home Financials are based on the most recent Mortgage that was taken out on this home.
Original Mortgage
$53,531
Outstanding Balance
$32,348
Interest Rate
6.23%
Mortgage Type
FHA
Estimated Equity
$72,363
Purchase Details
Closed on
Jan 4, 2005
Sold by
Russo Gennaro
Bought by
Russo Neil
Purchase Details
Closed on
Jan 1, 1990
Bought by
Gennaro Russo
Create a Home Valuation Report for This Property
The Home Valuation Report is an in-depth analysis detailing your home's value as well as a comparison with similar homes in the area
Home Values in the Area
Average Home Value in this Area
Purchase History
| Date | Buyer | Sale Price | Title Company |
|---|---|---|---|
| Hall Jeremy J | $58,600 | None Available | |
| Hall Jeremy J | $58,600 | None Available | |
| Russo Neil | $53,100 | -- | |
| Gennaro Russo | -- | -- |
Source: Public Records
Mortgage History
| Date | Status | Borrower | Loan Amount |
|---|---|---|---|
| Open | Russo Neil | $53,531 | |
| Closed | Hall Jeremy J | $53,531 |
Source: Public Records
Tax History Compared to Growth
Tax History
| Year | Tax Paid | Tax Assessment Tax Assessment Total Assessment is a certain percentage of the fair market value that is determined by local assessors to be the total taxable value of land and additions on the property. | Land | Improvement |
|---|---|---|---|---|
| 2024 | $1,034 | $24,120 | $3,150 | $20,970 |
| 2023 | $1,034 | $24,120 | $3,150 | $20,970 |
| 2022 | $961 | $19,150 | $3,150 | $16,000 |
| 2021 | $1,010 | $19,150 | $3,150 | $16,000 |
| 2020 | $1,019 | $19,150 | $3,150 | $16,000 |
| 2019 | $988 | $17,680 | $3,150 | $14,530 |
| 2018 | $985 | $17,680 | $3,150 | $14,530 |
| 2017 | $980 | $17,680 | $3,150 | $14,530 |
| 2016 | $962 | $17,190 | $3,150 | $14,040 |
| 2015 | $951 | $17,190 | $3,150 | $14,040 |
| 2014 | $955 | $17,190 | $3,150 | $14,040 |
| 2013 | $1,006 | $19,110 | $3,150 | $15,960 |
Source: Public Records
Map
Nearby Homes
- 816 Fenton St
- 611 Mason St
- 39 Belmont Ave
- 17 Belmont Ave
- 29 S Bentley Ave
- 719 Robbins Ave
- 839 Robbins Ave
- 504 High Ave
- 311 High Ave
- 4,6,8 Lafayette
- 0 Summit
- 21 Summit Ave
- 107 Hogarth Ave
- 404 N Bentley Ave
- 322 Morse Ave
- 416 N Cedar Ave
- 126 S Rhodes Ave
- 364 Hogarth Ave
- 0 Hughes St SE
- 719 Lafayette Ave