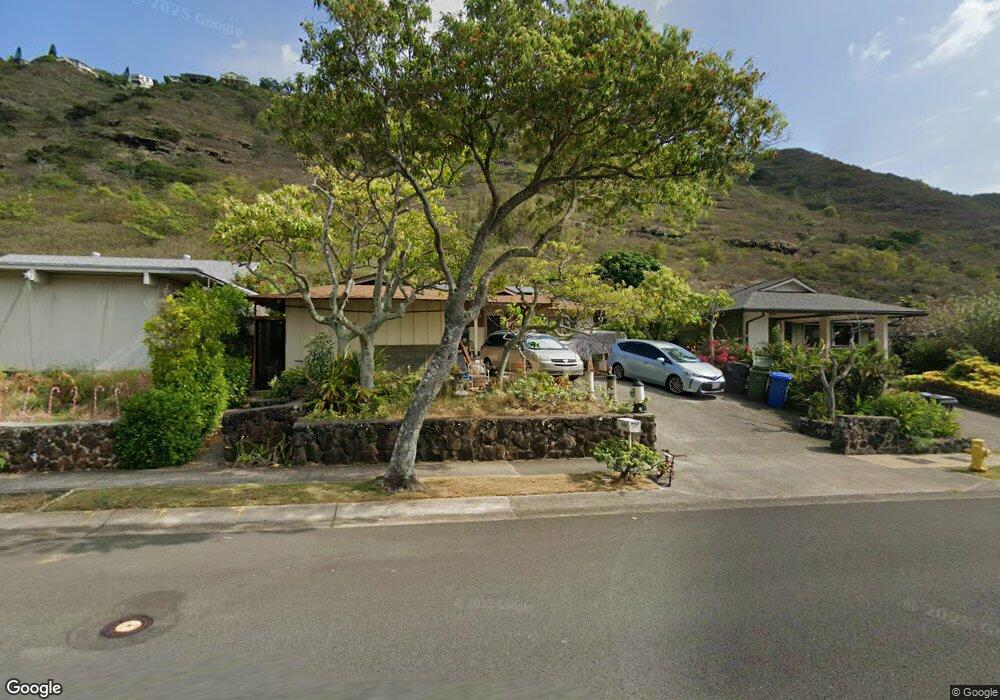
703 Hahaione St Honolulu, HI 96825
Hawaii Kai NeighborhoodEstimated Value: $1,379,000 - $1,519,000
3
Beds
2
Baths
1,594
Sq Ft
$903/Sq Ft
Est. Value
About This Home
This home is located at 703 Hahaione St, Honolulu, HI 96825 and is currently estimated at $1,439,473, approximately $903 per square foot. 703 Hahaione St is a home located in Honolulu County with nearby schools including Haha'ione Elementary School, Niu Valley Middle School, and Honolulu Waldorf School.
Ownership History
Date
Name
Owned For
Owner Type
Purchase Details
Closed on
Sep 20, 2011
Sold by
Kurakawa Yasuko
Bought by
Burdick Justin Michael and Burdick Jessica Habetler
Current Estimated Value
Home Financials for this Owner
Home Financials are based on the most recent Mortgage that was taken out on this home.
Original Mortgage
$684,150
Outstanding Balance
$468,502
Interest Rate
4.26%
Mortgage Type
FHA
Estimated Equity
$970,971
Purchase Details
Closed on
Oct 13, 2010
Sold by
Kurakawa Yasuko
Bought by
Kurakawa Yasuko and The Yasuko Kurakawa Trust
Purchase Details
Closed on
Mar 9, 2005
Sold by
Takazono Enid Chiyo and Uehara Hazel Hatsuyo
Bought by
Kurakawa Yasuko
Home Financials for this Owner
Home Financials are based on the most recent Mortgage that was taken out on this home.
Original Mortgage
$400,000
Interest Rate
5.62%
Mortgage Type
Unknown
Create a Home Valuation Report for This Property
The Home Valuation Report is an in-depth analysis detailing your home's value as well as a comparison with similar homes in the area
Home Values in the Area
Average Home Value in this Area
Purchase History
| Date | Buyer | Sale Price | Title Company |
|---|---|---|---|
| Burdick Justin Michael | $709,000 | Fam | |
| Kurakawa Yasuko | -- | None Available | |
| Kurakawa Yasuko | $525,000 | -- |
Source: Public Records
Mortgage History
| Date | Status | Borrower | Loan Amount |
|---|---|---|---|
| Open | Burdick Justin Michael | $684,150 | |
| Previous Owner | Kurakawa Yasuko | $400,000 |
Source: Public Records
Tax History Compared to Growth
Tax History
| Year | Tax Paid | Tax Assessment Tax Assessment Total Assessment is a certain percentage of the fair market value that is determined by local assessors to be the total taxable value of land and additions on the property. | Land | Improvement |
|---|---|---|---|---|
| 2025 | $3,762 | $1,154,900 | $959,200 | $195,700 |
| 2024 | $3,762 | $1,194,900 | $934,000 | $260,900 |
| 2023 | $3,958 | $1,330,800 | $934,000 | $396,800 |
| 2022 | $3,782 | $1,180,700 | $858,300 | $322,400 |
| 2021 | $3,026 | $964,700 | $747,200 | $217,500 |
| 2020 | $2,761 | $888,800 | $747,200 | $141,600 |
| 2019 | $3,053 | $952,300 | $737,100 | $215,200 |
| 2018 | $2,936 | $918,900 | $716,900 | $202,000 |
| 2017 | $2,811 | $883,000 | $666,400 | $216,600 |
| 2016 | $2,745 | $864,200 | $610,900 | $253,300 |
| 2015 | $2,576 | $816,100 | $585,600 | $230,500 |
| 2014 | -- | $774,200 | $550,300 | $223,900 |
Source: Public Records
Map
Nearby Homes
- 856 Kii St
- 665 Hahaione St
- 730 Ainapo St
- 612 Ainapo St
- 555 Hahaione St Unit 5E
- 555 Hahaione St Unit 12D
- 1048 Kaupaku Place
- 521 Pepeekeo St Unit 8
- 553 Pepeekeo St Unit 436CA
- 521 Hahaione St Unit 2/6H
- 521 Hahaione St Unit 10G
- 521 Hahaione St Unit 26J
- 501 Hahaione St Unit 119J
- 521 Hahaione St Unit 217H
- 521 Hahaione St Unit 12J
- 521 Hahaione St Unit 215L
- 531 Hahaione St Unit 2/1A
- 531 Hahaione St Unit 2/19B
- 531 Hahaione St Unit 2/9A
- 501 Hahaione St Unit 19-J
- 699 Hahaione St
- 705 Hahaione St
- 693 Hahaione St
- 709 Hahaione St
- 702 Hahaione St
- 689 Hahaione St
- 706 Hahaione St
- 698 Hahaione St
- 715 Hahaione St
- 710 Hahaione St
- 694 Hahaione St
- 683 Hahaione St
- 690 Hahaione St
- 714 Hahaione St
- 721 Hahaione St
- 684 Hahaione St
- 681 Hahaione St
- 718 Hahaione St
- 723 Hahaione St
- 680 Hahaione St