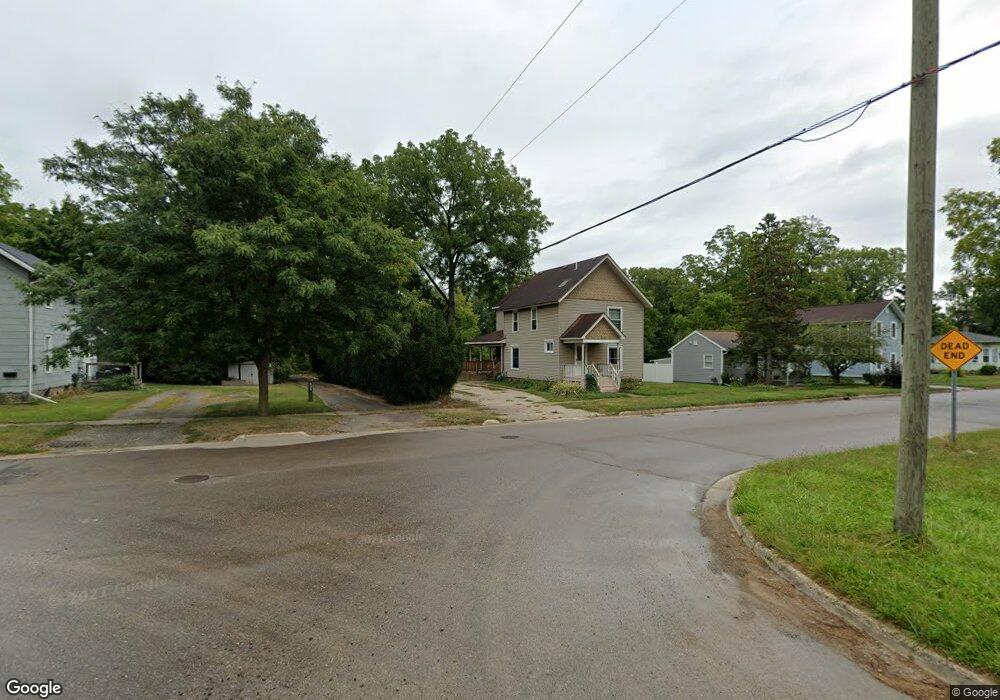
703 High St Williamston, MI 48895
Estimated Value: $232,835 - $311,000
4
Beds
1
Bath
1,616
Sq Ft
$160/Sq Ft
Est. Value
About This Home
This home is located at 703 High St, Williamston, MI 48895 and is currently estimated at $258,709, approximately $160 per square foot. 703 High St is a home located in Ingham County with nearby schools including Williamston Discovery Elementary School, Williamston Explorer Elementary School, and Williamston Middle School.
Ownership History
Date
Name
Owned For
Owner Type
Purchase Details
Closed on
Aug 1, 2005
Sold by
Davies Jeanne Marie and Davies Jeanne M
Bought by
Geyer Steve R and Geyer Patricia A
Current Estimated Value
Home Financials for this Owner
Home Financials are based on the most recent Mortgage that was taken out on this home.
Original Mortgage
$113,000
Outstanding Balance
$59,360
Interest Rate
5.66%
Mortgage Type
Fannie Mae Freddie Mac
Estimated Equity
$199,349
Purchase Details
Closed on
Jul 21, 1995
Sold by
Sanchez Alexander B and Sanchez Judy A
Bought by
Davies Jeanne Marie
Create a Home Valuation Report for This Property
The Home Valuation Report is an in-depth analysis detailing your home's value as well as a comparison with similar homes in the area
Home Values in the Area
Average Home Value in this Area
Purchase History
| Date | Buyer | Sale Price | Title Company |
|---|---|---|---|
| Geyer Steve R | $128,000 | Multiple | |
| Davies Jeanne Marie | $87,000 | -- |
Source: Public Records
Mortgage History
| Date | Status | Borrower | Loan Amount |
|---|---|---|---|
| Open | Geyer Steve R | $113,000 |
Source: Public Records
Tax History
| Year | Tax Paid | Tax Assessment Tax Assessment Total Assessment is a certain percentage of the fair market value that is determined by local assessors to be the total taxable value of land and additions on the property. | Land | Improvement |
|---|---|---|---|---|
| 2025 | $4,070 | $106,000 | $34,300 | $71,700 |
| 2024 | $3,805 | $103,400 | $38,800 | $64,600 |
| 2023 | $3,805 | $91,200 | $29,700 | $61,500 |
| 2022 | $3,624 | $83,200 | $27,400 | $55,800 |
| 2021 | $3,552 | $76,700 | $20,100 | $56,600 |
| 2020 | $3,448 | $72,300 | $20,100 | $52,200 |
| 2019 | $3,308 | $69,600 | $16,500 | $53,100 |
| 2018 | $3,249 | $66,300 | $17,800 | $48,500 |
| 2017 | $3,106 | $65,300 | $16,000 | $49,300 |
| 2016 | -- | $61,200 | $13,600 | $47,600 |
| 2015 | -- | $57,600 | $25,247 | $32,353 |
| 2014 | -- | $55,900 | $29,519 | $26,381 |
Source: Public Records
Map
Nearby Homes
- 824 E Grand River Ave
- 1532 Lytell Johne's Path #77
- 1544 Nottingham Forest Trail #63
- 305 E Middle St
- 211 Deep Lake Dr
- 508 Red Cedar Blvd
- 500 Red Cedar Blvd
- 111 Block St
- 545 Red Cedar Blvd
- 2445 E Grand River Rd Lot#2
- 2445 E
- 0 Vanneter Rd
- 0 Hiddenview Ln
- 2418 Knollridge Ln
- 719 Williams St
- 875 W Grand River Ave Unit 35
- 875 W Grand River Ave Unit 29
- 4151 Meadowdale Dr
- 1521 Nottingham Forest Trail Unit 50
- 1530 Lytell Johne's Path #78
Your Personal Tour Guide
Ask me questions while you tour the home.