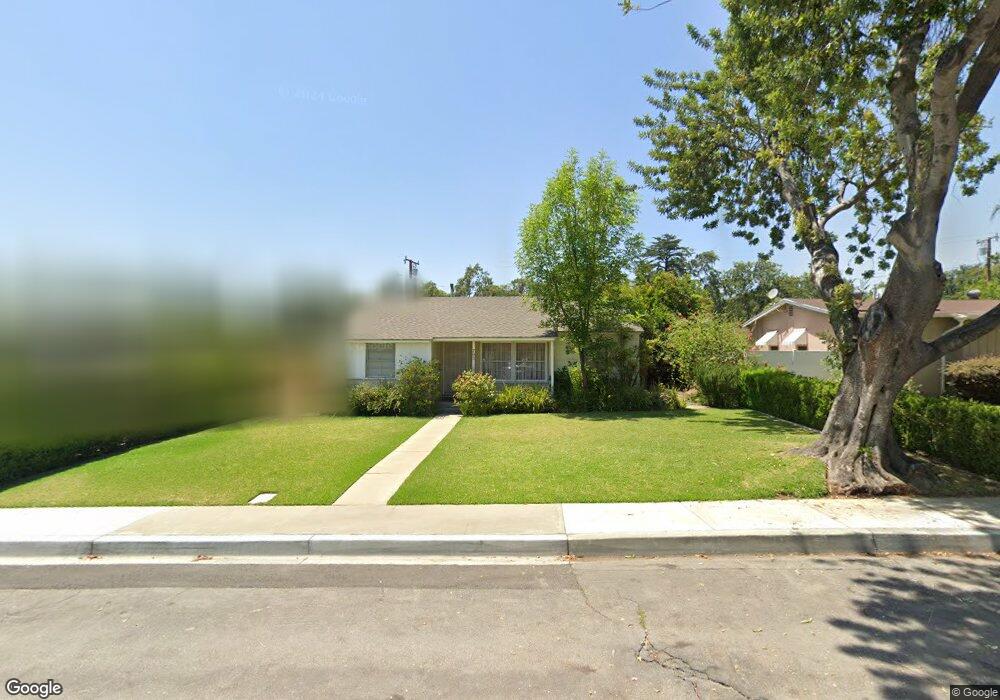
703 N Redding Way Upland, CA 91786
Estimated Value: $607,000 - $725,000
3
Beds
1
Bath
1,012
Sq Ft
$644/Sq Ft
Est. Value
About This Home
This home is located at 703 N Redding Way, Upland, CA 91786 and is currently estimated at $652,103, approximately $644 per square foot. 703 N Redding Way is a home located in San Bernardino County with nearby schools including Baldy View Elementary School, Upland Junior High School, and Upland High School.
Ownership History
Date
Name
Owned For
Owner Type
Purchase Details
Closed on
Nov 18, 2020
Sold by
Morris Kevin
Bought by
Morris Kevin and The Morris Family Trust
Current Estimated Value
Purchase Details
Closed on
Apr 19, 2010
Sold by
The Secretary Of Housing & Urban Develop
Bought by
Morris Kevin L
Home Financials for this Owner
Home Financials are based on the most recent Mortgage that was taken out on this home.
Original Mortgage
$176,000
Outstanding Balance
$116,698
Interest Rate
4.91%
Mortgage Type
New Conventional
Estimated Equity
$535,405
Purchase Details
Closed on
Dec 3, 2009
Sold by
Government National Mortgage Association
Bought by
The Secretary Of Housing & Urban Develop
Purchase Details
Closed on
Nov 30, 2009
Sold by
Bovee Johnny C
Bought by
Government National Mortgage Association
Purchase Details
Closed on
Jan 19, 2005
Sold by
Lal Pranil
Bought by
Bovee Johnny C and Bovee Denise Ann
Home Financials for this Owner
Home Financials are based on the most recent Mortgage that was taken out on this home.
Original Mortgage
$280,000
Interest Rate
6.5%
Mortgage Type
New Conventional
Purchase Details
Closed on
May 17, 2004
Sold by
Singh Julie Jasveer
Bought by
Lal Pranil
Home Financials for this Owner
Home Financials are based on the most recent Mortgage that was taken out on this home.
Original Mortgage
$252,000
Interest Rate
6.25%
Mortgage Type
Purchase Money Mortgage
Purchase Details
Closed on
Apr 8, 2004
Sold by
Perchlak Donald
Bought by
Lal Pranil
Home Financials for this Owner
Home Financials are based on the most recent Mortgage that was taken out on this home.
Original Mortgage
$252,000
Interest Rate
6.25%
Mortgage Type
Purchase Money Mortgage
Purchase Details
Closed on
Mar 5, 2001
Sold by
Chaputa Erik S
Bought by
Perchlak Donald A
Home Financials for this Owner
Home Financials are based on the most recent Mortgage that was taken out on this home.
Original Mortgage
$167,275
Interest Rate
7.06%
Mortgage Type
FHA
Purchase Details
Closed on
May 23, 2000
Sold by
Carson Bruce
Bought by
Chaputa Erik S and Chaputa Darleen L
Home Financials for this Owner
Home Financials are based on the most recent Mortgage that was taken out on this home.
Original Mortgage
$156,250
Interest Rate
8.18%
Mortgage Type
Stand Alone First
Create a Home Valuation Report for This Property
The Home Valuation Report is an in-depth analysis detailing your home's value as well as a comparison with similar homes in the area
Home Values in the Area
Average Home Value in this Area
Purchase History
| Date | Buyer | Sale Price | Title Company |
|---|---|---|---|
| Morris Kevin | -- | None Available | |
| Morris Kevin L | $220,000 | Lawyers Title Company | |
| The Secretary Of Housing & Urban Develop | -- | Landsafe Title | |
| Government National Mortgage Association | $319,701 | Landsafe Title | |
| Government National Mortgage Association | $319,701 | Landsafe | |
| Bovee Johnny C | $350,000 | Atc-Glendale | |
| Lal Pranil | -- | Atc-Glendale | |
| Lal Pranil | $315,000 | Atc-Glendale | |
| Perchlak Donald A | $170,000 | Landsafe Title | |
| Chaputa Erik S | -- | First American Title Ins Co |
Source: Public Records
Mortgage History
| Date | Status | Borrower | Loan Amount |
|---|---|---|---|
| Open | Morris Kevin L | $176,000 | |
| Previous Owner | Bovee Johnny C | $280,000 | |
| Previous Owner | Lal Pranil | $252,000 | |
| Previous Owner | Perchlak Donald A | $167,275 | |
| Previous Owner | Chaputa Erik S | $156,250 | |
| Closed | Lal Pranil | $63,000 | |
| Closed | Bovee Johnny C | $70,000 |
Source: Public Records
Tax History Compared to Growth
Tax History
| Year | Tax Paid | Tax Assessment Tax Assessment Total Assessment is a certain percentage of the fair market value that is determined by local assessors to be the total taxable value of land and additions on the property. | Land | Improvement |
|---|---|---|---|---|
| 2025 | $3,077 | $283,986 | $99,395 | $184,591 |
| 2024 | $3,077 | $278,418 | $97,446 | $180,972 |
| 2023 | $3,028 | $272,959 | $95,535 | $177,424 |
| 2022 | $2,961 | $267,607 | $93,662 | $173,945 |
| 2021 | $2,953 | $262,359 | $91,825 | $170,534 |
| 2020 | $2,947 | $259,668 | $90,883 | $168,785 |
| 2019 | $2,938 | $254,576 | $89,101 | $165,475 |
| 2018 | $2,868 | $249,584 | $87,354 | $162,230 |
| 2017 | $2,786 | $244,690 | $85,641 | $159,049 |
| 2016 | $2,594 | $239,892 | $83,962 | $155,930 |
| 2015 | $2,535 | $236,289 | $82,701 | $153,588 |
| 2014 | $2,470 | $231,660 | $81,081 | $150,579 |
Source: Public Records
Map
Nearby Homes
- 855 N Palm Ave
- 910 N Redding Way Unit F
- 928 N Redding Way Unit D
- 435 W 9th St Unit F5
- 435 W 9th St Unit B3
- 537 W 9th St
- 125 Towns Ave
- 0 Bay St Unit AR25093919
- 691 N 3rd Ave
- Plan 3 at Towns on First - Towns On First
- Plan 4 at Towns on First - Towns On First
- 1234 N Laurel Ave
- 595 Juniper Ave
- 119 N 1st Ave
- 164 Euclid Place
- 173 W 8th St
- 681 Birch Ave
- 823 N 5th Ave
- 228 Greentree Rd
- 952 N 4th Ave
- 689 N Redding Way
- 719 N Redding Way
- 675 N Redding Way
- 731 N Redding Way
- 704 N Shasta Way
- 686 N Shasta Way
- 716 N Shasta Way
- 704 N Redding Way
- 672 N Shasta Way
- 730 N Shasta Way
- 686 N Redding Way
- 716 N Redding Way
- 661 N Redding Way
- 747 N Redding Way
- 672 N Redding Way
- 730 N Redding Way
- 744 N Shasta Way
- 656 N Shasta Way
- 645 N Redding Way
- 763 N Redding Way