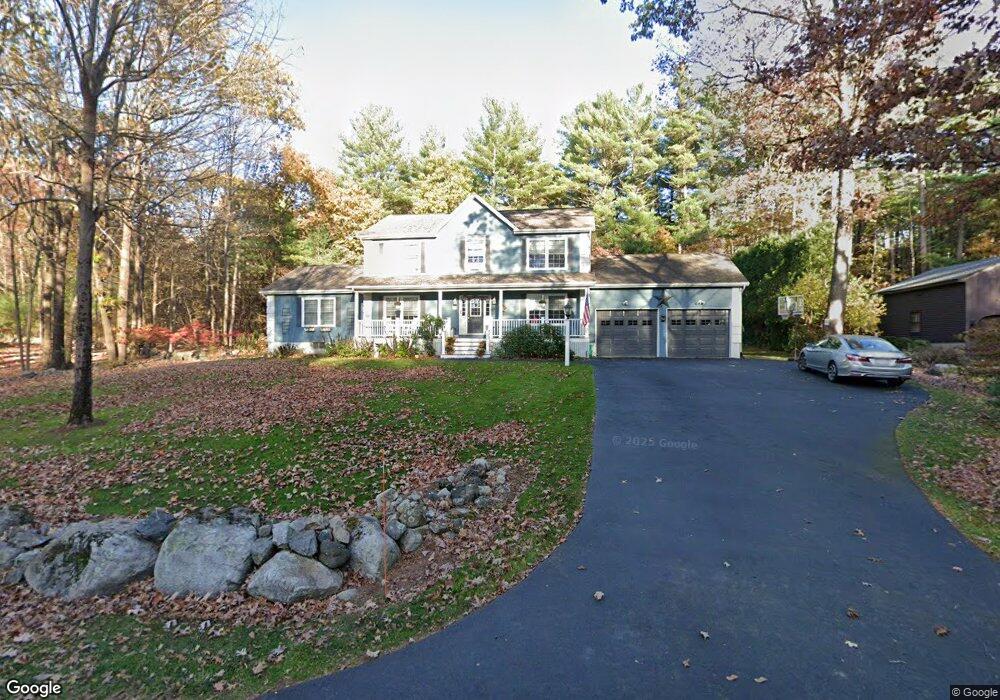
703 Pearl St Reading, MA 01867
Estimated Value: $1,275,000 - $1,443,000
4
Beds
3
Baths
2,760
Sq Ft
$487/Sq Ft
Est. Value
About This Home
This home is located at 703 Pearl St, Reading, MA 01867 and is currently estimated at $1,344,563, approximately $487 per square foot. 703 Pearl St is a home located in Middlesex County with nearby schools including Wood End Elementary School, Arthur W. Coolidge Middle School, and Reading Memorial High School.
Ownership History
Date
Name
Owned For
Owner Type
Purchase Details
Closed on
Jun 21, 2010
Sold by
Howse Randall and Howse Anne M
Bought by
Vanderzonwen Mark S
Current Estimated Value
Home Financials for this Owner
Home Financials are based on the most recent Mortgage that was taken out on this home.
Original Mortgage
$499,400
Interest Rate
5.03%
Mortgage Type
Purchase Money Mortgage
Purchase Details
Closed on
Apr 25, 1991
Sold by
Wilkes Joseph W and Harvey-Wilkes Karen
Bought by
Clinton Robert L and Clinton Dianne
Home Financials for this Owner
Home Financials are based on the most recent Mortgage that was taken out on this home.
Original Mortgage
$90,000
Interest Rate
9.41%
Mortgage Type
Purchase Money Mortgage
Purchase Details
Closed on
Mar 31, 1987
Sold by
Highland Street Tr
Bought by
Kimball Court Apts
Create a Home Valuation Report for This Property
The Home Valuation Report is an in-depth analysis detailing your home's value as well as a comparison with similar homes in the area
Home Values in the Area
Average Home Value in this Area
Purchase History
| Date | Buyer | Sale Price | Title Company |
|---|---|---|---|
| Vanderzonwen Mark S | $624,300 | -- | |
| Clinton Robert L | $180,000 | -- | |
| Kimball Court Apts | $1,440,000 | -- |
Source: Public Records
Mortgage History
| Date | Status | Borrower | Loan Amount |
|---|---|---|---|
| Open | Kimball Court Apts | $494,000 | |
| Closed | Vanderzonwen Mark S | $499,400 | |
| Previous Owner | Kimball Court Apts | $90,000 |
Source: Public Records
Tax History Compared to Growth
Tax History
| Year | Tax Paid | Tax Assessment Tax Assessment Total Assessment is a certain percentage of the fair market value that is determined by local assessors to be the total taxable value of land and additions on the property. | Land | Improvement |
|---|---|---|---|---|
| 2025 | $12,982 | $1,139,800 | $492,600 | $647,200 |
| 2024 | $12,959 | $1,105,700 | $477,700 | $628,000 |
| 2023 | $12,148 | $964,900 | $416,100 | $548,800 |
| 2022 | $11,554 | $866,800 | $373,200 | $493,600 |
| 2021 | $11,356 | $822,300 | $358,200 | $464,100 |
| 2020 | $11,245 | $806,100 | $351,100 | $455,000 |
| 2019 | $10,934 | $768,400 | $334,400 | $434,000 |
| 2018 | $0 | $718,500 | $312,300 | $406,200 |
| 2017 | $9,644 | $687,400 | $298,500 | $388,900 |
| 2016 | $9,905 | $683,100 | $317,600 | $365,500 |
| 2015 | $9,295 | $632,300 | $293,500 | $338,800 |
| 2014 | $9,012 | $611,400 | $283,600 | $327,800 |
Source: Public Records
Map
Nearby Homes
- 8 Partridge Rd
- 684 Haverhill St
- 9 Mill St
- 11 Clover Cir Unit A
- 98 Lilah Ln
- 38 Main St Unit 15
- 290 Park St
- 37 Eames St
- 409 Haverhill St
- 0 Charles St Unit 72374573
- 217 Park St
- 20 Marshall St
- 149 Forest St
- 18 Symonds Way
- 25 Martin Rd
- 3 Gordon Rd
- 28 Martin Rd
- 114 Haverhill St
- 56 Mount Vernon St
- 33 Marla Ln