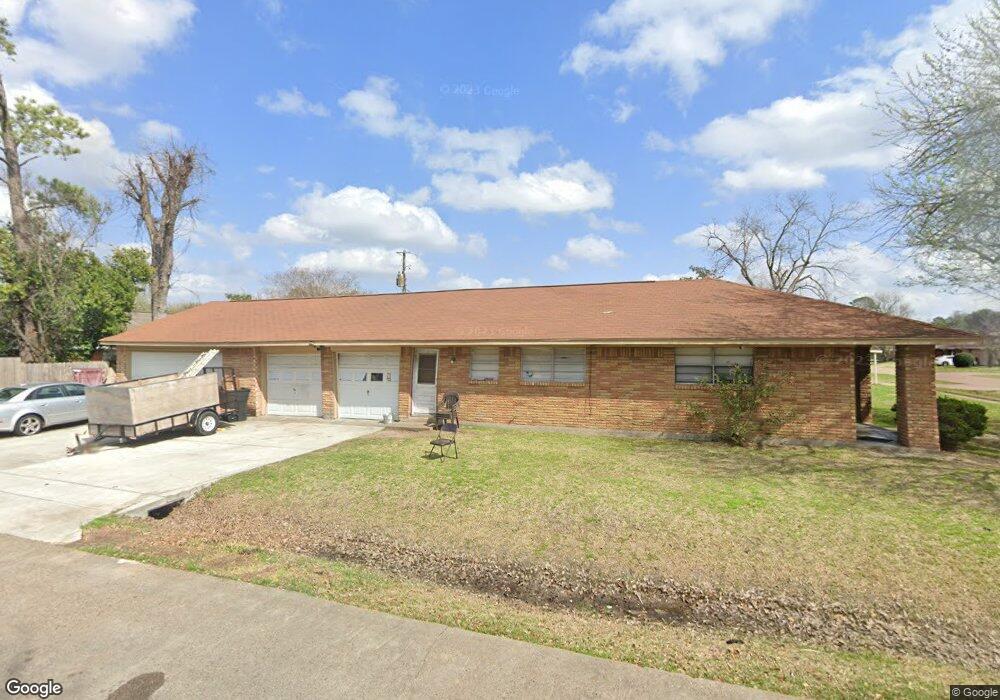
703 Pennington St Houston, TX 77022
Northside-Northline NeighborhoodEstimated Value: $250,000 - $301,000
3
Beds
2
Baths
1,716
Sq Ft
$161/Sq Ft
Est. Value
About This Home
This home is located at 703 Pennington St, Houston, TX 77022 and is currently estimated at $275,936, approximately $160 per square foot. 703 Pennington St is a home located in Harris County with nearby schools including Burbank Elementary School, Burbank Middle School, and Sam Houston Math, Science & Technology Center.
Ownership History
Date
Name
Owned For
Owner Type
Purchase Details
Closed on
Oct 9, 2015
Sold by
Us Bank Na
Bought by
Franco Efrain and Franco Christina
Current Estimated Value
Purchase Details
Closed on
Sep 2, 2015
Sold by
Nationstar Mortgage Llc
Bought by
Us Bank Na
Purchase Details
Closed on
Jul 7, 2015
Sold by
Gibbs Charles R and Reynolds Frances R
Bought by
Mortgage Equity Conversion Asset Trust 2
Purchase Details
Closed on
Apr 26, 2004
Sold by
Gibbs Charles R
Bought by
Reynolds Frances R
Home Financials for this Owner
Home Financials are based on the most recent Mortgage that was taken out on this home.
Original Mortgage
$162,000
Interest Rate
2.91%
Mortgage Type
FHA
Purchase Details
Closed on
Nov 14, 1997
Sold by
Evans John
Bought by
Gibbs Charles R
Home Financials for this Owner
Home Financials are based on the most recent Mortgage that was taken out on this home.
Original Mortgage
$45,645
Interest Rate
10.5%
Create a Home Valuation Report for This Property
The Home Valuation Report is an in-depth analysis detailing your home's value as well as a comparison with similar homes in the area
Home Values in the Area
Average Home Value in this Area
Purchase History
| Date | Buyer | Sale Price | Title Company |
|---|---|---|---|
| Franco Efrain | -- | None Available | |
| Us Bank Na | -- | None Available | |
| Mortgage Equity Conversion Asset Trust 2 | $85,000 | None Available | |
| Reynolds Frances R | -- | -- | |
| Gibbs Charles R | -- | Alamo Title |
Source: Public Records
Mortgage History
| Date | Status | Borrower | Loan Amount |
|---|---|---|---|
| Previous Owner | Reynolds Frances R | $162,000 | |
| Previous Owner | Gibbs Charles R | $45,645 |
Source: Public Records
Tax History Compared to Growth
Tax History
| Year | Tax Paid | Tax Assessment Tax Assessment Total Assessment is a certain percentage of the fair market value that is determined by local assessors to be the total taxable value of land and additions on the property. | Land | Improvement |
|---|---|---|---|---|
| 2025 | $5,095 | $218,648 | $104,614 | $114,034 |
| 2024 | $5,095 | $243,514 | $96,011 | $147,503 |
| 2023 | $5,095 | $277,160 | $58,501 | $218,659 |
| 2022 | $5,348 | $242,885 | $58,501 | $184,384 |
| 2021 | $4,471 | $191,817 | $58,501 | $133,316 |
| 2020 | $4,276 | $176,576 | $58,501 | $118,075 |
| 2019 | $4,388 | $173,417 | $48,178 | $125,239 |
| 2018 | $3,526 | $139,359 | $40,263 | $99,096 |
| 2017 | $3,524 | $139,359 | $40,263 | $99,096 |
| 2016 | $2,965 | $117,260 | $37,854 | $79,406 |
| 2015 | $390 | $83,000 | $27,530 | $55,470 |
| 2014 | $390 | $83,000 | $27,530 | $55,470 |
Source: Public Records
Map
Nearby Homes
- 702 Pennington St
- 807 Firnat St
- 9026 Mcgallion Rd
- 1207 Firnat St
- 723 Doverside St
- 318 Charlock St
- 415 Briarcliff Dr
- 253 De Boll St
- 249 De Boll St
- 216 Burress St
- 88 Berry Rd
- 411 Berry Rd
- 202 Burbank St
- 219 Heaney Dr
- 8411 Berry Brush Ln
- 8402 Berry Green Ln
- 9650 E Hardy Rd
- 802 Berry Sage Ln
- 108 Fichter St
- 132 Grothe Ln
- 707 Pennington St
- 702 Hurley St
- 706 Hurley St
- 711 Pennington St
- 9207 Helmers St
- 9211 Helmers St
- 9203 Helmers St
- 710 Hurley St
- 706 Pennington St
- 9215 Helmers St
- 715 Pennington St
- 710 Pennington St
- 714 Hurley St
- 9131 Helmers St
- 714 Pennington St
- 703 Hurley St
- 643 Hurley St
- 703 Hohl St
- 9210 Melrose St
- 9214 Melrose St