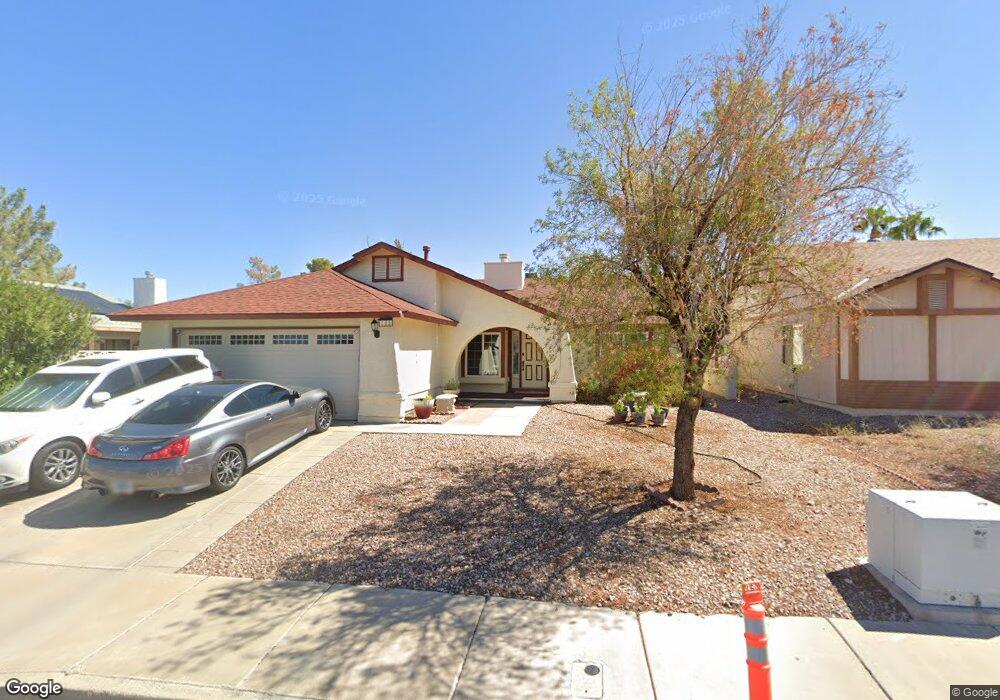
703 Skipjack Dr Unit 2 Henderson, NV 89015
Foothills NeighborhoodEstimated Value: $396,724 - $438,000
3
Beds
2
Baths
1,678
Sq Ft
$250/Sq Ft
Est. Value
About This Home
This home is located at 703 Skipjack Dr Unit 2, Henderson, NV 89015 and is currently estimated at $420,181, approximately $250 per square foot. 703 Skipjack Dr Unit 2 is a home located in Clark County with nearby schools including Sue H. Morrow Elementary School, B Mahlon Brown Academy of International Studies, and Basic Academy of International Studies.
Ownership History
Date
Name
Owned For
Owner Type
Purchase Details
Closed on
Aug 25, 2004
Sold by
Klein Caliging Callie
Bought by
Kogel Kim E and Kogel Melani D
Current Estimated Value
Home Financials for this Owner
Home Financials are based on the most recent Mortgage that was taken out on this home.
Original Mortgage
$246,813
Outstanding Balance
$117,833
Interest Rate
5.76%
Mortgage Type
VA
Estimated Equity
$302,348
Purchase Details
Closed on
Jun 24, 2004
Sold by
Caliging Jefferson L
Bought by
Klein Caliging Callie J
Home Financials for this Owner
Home Financials are based on the most recent Mortgage that was taken out on this home.
Original Mortgage
$179,950
Interest Rate
6.31%
Mortgage Type
New Conventional
Purchase Details
Closed on
Apr 28, 1998
Sold by
Best Jacqueline R
Bought by
Best Thomas A
Purchase Details
Closed on
Sep 29, 1995
Sold by
Turner Alfred Albert
Bought by
Best Tom A and Best Jacqueline R
Home Financials for this Owner
Home Financials are based on the most recent Mortgage that was taken out on this home.
Original Mortgage
$111,188
Interest Rate
7.97%
Mortgage Type
Assumption
Create a Home Valuation Report for This Property
The Home Valuation Report is an in-depth analysis detailing your home's value as well as a comparison with similar homes in the area
Home Values in the Area
Average Home Value in this Area
Purchase History
| Date | Buyer | Sale Price | Title Company |
|---|---|---|---|
| Kogel Kim E | $242,000 | Chicago Title | |
| Klein Caliging Callie J | -- | Old Republic Title Co Of Ne | |
| Klein Caliging Callie | $199,999 | Old Republic Title Co Of Ne | |
| Best Thomas A | -- | Old Republic Title Co Of Ne | |
| Best Thomas A | -- | -- | |
| Best Tom A | $108,000 | First American Title Co |
Source: Public Records
Mortgage History
| Date | Status | Borrower | Loan Amount |
|---|---|---|---|
| Open | Kogel Kim E | $246,813 | |
| Previous Owner | Klein Caliging Callie J | $179,950 | |
| Previous Owner | Best Tom A | $111,188 |
Source: Public Records
Tax History
| Year | Tax Paid | Tax Assessment Tax Assessment Total Assessment is a certain percentage of the fair market value that is determined by local assessors to be the total taxable value of land and additions on the property. | Land | Improvement |
|---|---|---|---|---|
| 2026 | $1,694 | $82,394 | $32,550 | $49,844 |
| 2025 | $1,569 | $79,002 | $28,000 | $51,002 |
| 2024 | $1,453 | $79,002 | $28,000 | $51,002 |
| 2023 | $1,453 | $78,066 | $29,050 | $49,016 |
| 2022 | $1,346 | $71,966 | $26,950 | $45,016 |
| 2021 | $1,246 | $64,706 | $21,700 | $43,006 |
| 2020 | $1,154 | $63,857 | $21,000 | $42,857 |
| 2019 | $1,082 | $61,650 | $19,250 | $42,400 |
| 2018 | $1,032 | $57,165 | $16,100 | $41,065 |
| 2017 | $1,628 | $56,069 | $14,350 | $41,719 |
| 2016 | $967 | $49,822 | $7,700 | $42,122 |
| 2015 | $964 | $38,636 | $7,700 | $30,936 |
| 2014 | $936 | $32,104 | $7,000 | $25,104 |
Source: Public Records
Map
Nearby Homes
- 152 Emden Dr
- 826 Anchor Dr
- 918 Clipper Dr
- 412 Cindy Place
- 163 Spinnaker Dr
- 907 N Major Ave
- 915 N Major Ave
- 206 Valerian St
- 846 Fairview Dr
- 865 Bussora Rose Dr
- 839 Fairview Dr
- 128 Ringlore Dr
- 1003 Palo Verde Dr
- 252 Hull St
- 737 Thorton Beach St
- 235 Winona Dr
- 923 Highland Trails Ave
- 1009 Driftwood Ct
- 610 Brownlee Dr
- 139 Constitution Ave
- 705 Skipjack Dr
- 139 Emden Dr
- 141 Emden Dr
- 800 Schooner Dr
- 707 Skipjack Dr
- 802 Schooner Dr
- 804 Schooner Dr
- 143 Emden Dr
- 806 Schooner Dr
- 704 Skipjack Dr
- 702 Skipjack Dr
- 709 Skipjack Dr
- 706 Skipjack Dr
- 808 Schooner Dr
- 700 Skipjack Dr
- 708 Skipjack Dr
- 711 Skipjack Dr
- 810 Schooner Dr
- 100 Spinnaker Dr
- 100 Spinnaker Dr Unit 1
Your Personal Tour Guide
Ask me questions while you tour the home.