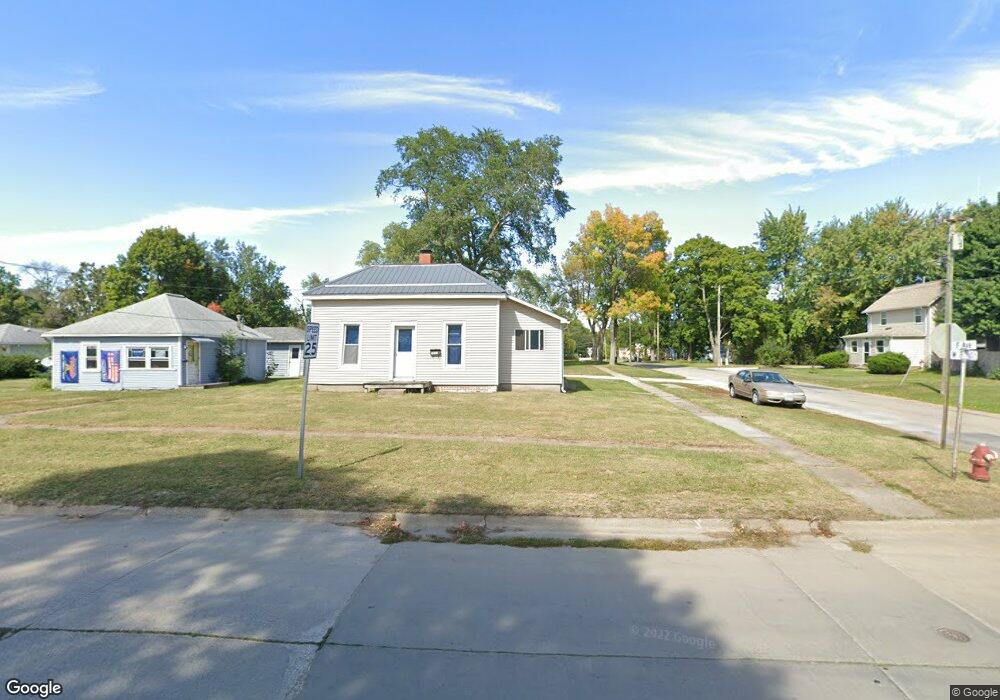
703 W 8th St Vinton, IA 52349
Estimated Value: $79,000 - $106,000
2
Beds
1
Bath
930
Sq Ft
$100/Sq Ft
Est. Value
About This Home
This home is located at 703 W 8th St, Vinton, IA 52349 and is currently estimated at $93,041, approximately $100 per square foot. 703 W 8th St is a home located in Benton County with nearby schools including Tilford Elementary School, Shellsburg Elementary School, and Vinton-Shellsburg Middle School.
Ownership History
Date
Name
Owned For
Owner Type
Purchase Details
Closed on
Sep 16, 2022
Sold by
Enos Christopher M and Enos Kari
Bought by
Wright David Russell
Current Estimated Value
Home Financials for this Owner
Home Financials are based on the most recent Mortgage that was taken out on this home.
Original Mortgage
$153,989
Interest Rate
4.99%
Mortgage Type
Credit Line Revolving
Purchase Details
Closed on
Feb 24, 2017
Sold by
Vinton Properties
Bought by
Enos Christopher and Enos Bobbi
Home Financials for this Owner
Home Financials are based on the most recent Mortgage that was taken out on this home.
Original Mortgage
$79,000
Interest Rate
4.16%
Create a Home Valuation Report for This Property
The Home Valuation Report is an in-depth analysis detailing your home's value as well as a comparison with similar homes in the area
Home Values in the Area
Average Home Value in this Area
Purchase History
| Date | Buyer | Sale Price | Title Company |
|---|---|---|---|
| Wright David Russell | $100,000 | -- | |
| Enos Christopher | -- | -- |
Source: Public Records
Mortgage History
| Date | Status | Borrower | Loan Amount |
|---|---|---|---|
| Closed | Wright David Russell | $153,989 | |
| Previous Owner | Enos Christopher | $79,000 | |
| Previous Owner | Enos Christopher | -- |
Source: Public Records
Tax History Compared to Growth
Tax History
| Year | Tax Paid | Tax Assessment Tax Assessment Total Assessment is a certain percentage of the fair market value that is determined by local assessors to be the total taxable value of land and additions on the property. | Land | Improvement |
|---|---|---|---|---|
| 2025 | $1,370 | $81,000 | $11,000 | $70,000 |
| 2024 | $1,370 | $73,100 | $10,500 | $62,600 |
| 2023 | $1,274 | $73,100 | $10,500 | $62,600 |
| 2022 | $1,308 | $59,200 | $8,400 | $50,800 |
| 2021 | $1,308 | $59,200 | $8,400 | $50,800 |
| 2020 | $1,150 | $53,100 | $5,600 | $47,500 |
| 2019 | $1,094 | $53,100 | $5,600 | $47,500 |
| 2018 | $1,062 | $49,900 | $5,000 | $44,900 |
| 2017 | $540 | $49,900 | $5,000 | $44,900 |
| 2016 | $530 | $24,600 | $4,700 | $19,900 |
| 2015 | $530 | $24,600 | $4,700 | $19,900 |
| 2014 | $536 | $24,800 | $0 | $0 |
Source: Public Records
Map
Nearby Homes