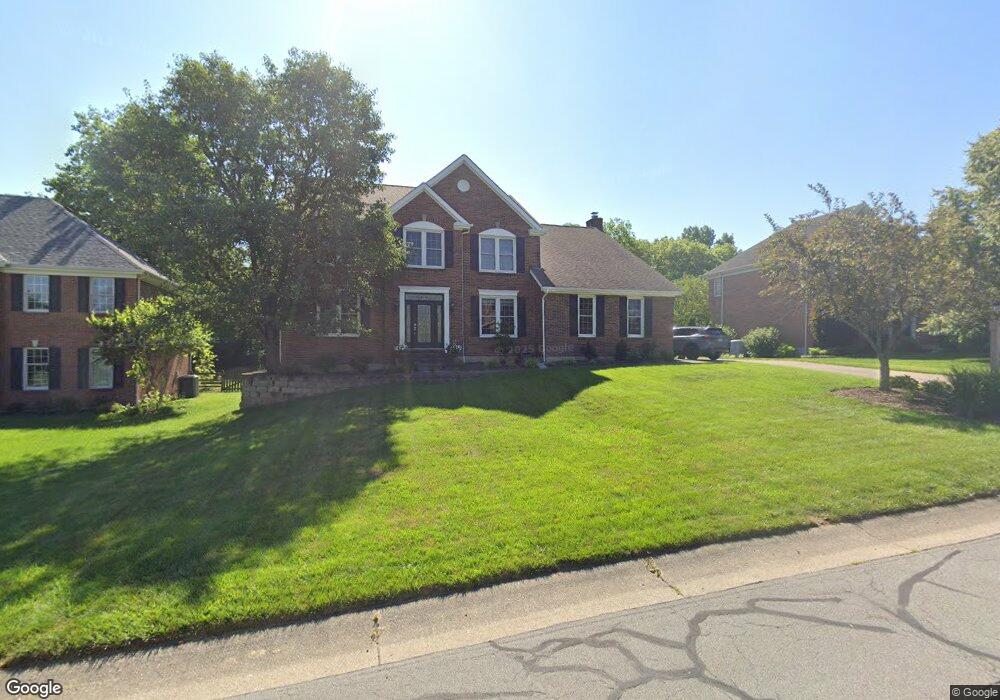
7030 Lindley Way Liberty Township, OH 45011
Estimated Value: $549,000 - $737,000
4
Beds
3
Baths
2,962
Sq Ft
$206/Sq Ft
Est. Value
About This Home
This home is located at 7030 Lindley Way, Liberty Township, OH 45011 and is currently estimated at $610,297, approximately $206 per square foot. 7030 Lindley Way is a home located in Butler County with nearby schools including Heritage Early Childhood School, Endeavor Elementary School, and Lakota Plains Junior School.
Ownership History
Date
Name
Owned For
Owner Type
Purchase Details
Closed on
Mar 27, 1999
Sold by
Rodgers Ricky C and Rodgers Janja A
Bought by
Szul Michael T and Szul Jill R
Current Estimated Value
Home Financials for this Owner
Home Financials are based on the most recent Mortgage that was taken out on this home.
Original Mortgage
$183,750
Outstanding Balance
$46,142
Interest Rate
6.94%
Estimated Equity
$564,155
Purchase Details
Closed on
Dec 17, 1997
Sold by
Campbell David F
Bought by
Rodgers Ricky C and Rodgers Tanja A
Home Financials for this Owner
Home Financials are based on the most recent Mortgage that was taken out on this home.
Original Mortgage
$198,450
Interest Rate
7.36%
Mortgage Type
Balloon
Purchase Details
Closed on
Sep 1, 1993
Purchase Details
Closed on
Aug 1, 1993
Purchase Details
Closed on
May 1, 1993
Create a Home Valuation Report for This Property
The Home Valuation Report is an in-depth analysis detailing your home's value as well as a comparison with similar homes in the area
Home Values in the Area
Average Home Value in this Area
Purchase History
| Date | Buyer | Sale Price | Title Company |
|---|---|---|---|
| Szul Michael T | $245,000 | -- | |
| Rodgers Ricky C | $233,500 | -- | |
| -- | $182,500 | -- | |
| -- | $228,000 | -- | |
| -- | $38,500 | -- |
Source: Public Records
Mortgage History
| Date | Status | Borrower | Loan Amount |
|---|---|---|---|
| Open | Szul Michael T | $183,750 | |
| Previous Owner | Rodgers Ricky C | $198,450 |
Source: Public Records
Tax History Compared to Growth
Tax History
| Year | Tax Paid | Tax Assessment Tax Assessment Total Assessment is a certain percentage of the fair market value that is determined by local assessors to be the total taxable value of land and additions on the property. | Land | Improvement |
|---|---|---|---|---|
| 2024 | $6,329 | $162,440 | $19,970 | $142,470 |
| 2023 | $6,250 | $163,250 | $19,970 | $143,280 |
| 2022 | $5,551 | $113,010 | $19,970 | $93,040 |
| 2021 | $5,522 | $113,010 | $19,970 | $93,040 |
| 2020 | $5,665 | $113,010 | $19,970 | $93,040 |
| 2019 | $9,796 | $101,690 | $19,850 | $81,840 |
| 2018 | $5,693 | $101,690 | $19,850 | $81,840 |
| 2017 | $5,790 | $101,690 | $19,850 | $81,840 |
| 2016 | $5,119 | $89,180 | $19,850 | $69,330 |
| 2015 | $5,125 | $89,180 | $19,850 | $69,330 |
| 2014 | $5,357 | $89,180 | $19,850 | $69,330 |
| 2013 | $5,357 | $90,170 | $23,810 | $66,360 |
Source: Public Records
Map
Nearby Homes
- 7001 Tarragon Ct
- 6060 Loganberry Ct
- 5981 Birkdale Dr
- 6168 Juneberry Ct
- 6638 Ashe Knoll
- 5716 E Senour Dr
- 5577 Dove Ln
- 5677 E Senour Dr
- 5663 E Senour Dr
- 6038 Glennsbury Ct
- 7078 Lakota Ridge Dr
- 6335 Dewberry Ct
- 7123 High Saddle Ct
- 7644 Eleventh Hour Ln
- 7690 Wharton Ct
- 6530 Bridgeton Manor Ct
- 5241 Hamilton Mason Rd
- 7077 Parliament Place
- 7534 Galway Ct
- 7628 Lesourdsville West Chester Rd
- 7040 Lindley Way
- 7020 Lindley Way
- 7050 Lindley Way
- 5754 Somerset Dr
- 7023 Lindley Way
- 7010 Lindley Way
- 7060 Lindley Way
- 5779 Chancery Place
- 5744 Somerset Dr
- 7000 Lindley Way
- 5753 Somerset Dr
- 7070 Lindley Way
- 5769 Chancery Place
- 7067 Lindley Way
- 5734 Somerset Dr
- 5759 Chancery Place
- 6996 Lindley Way
- 5729 Somerset Dr
- 7080 Lindley Way
- 5749 Chancery Place