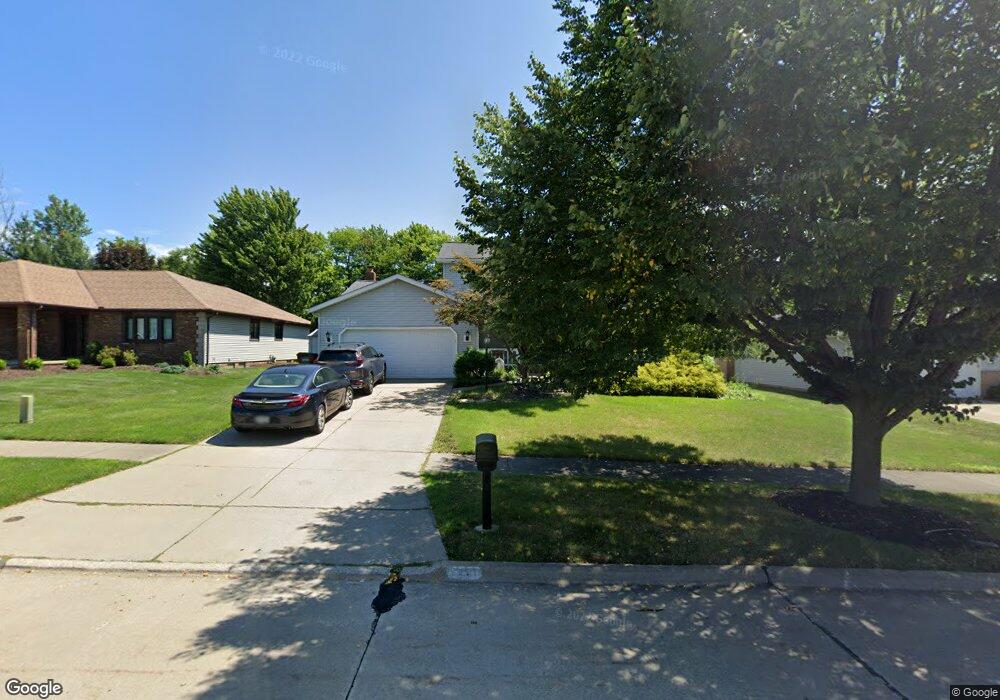
7031 E Parkview Dr Cleveland, OH 44134
Estimated Value: $304,000 - $356,000
4
Beds
3
Baths
2,346
Sq Ft
$145/Sq Ft
Est. Value
About This Home
This home is located at 7031 E Parkview Dr, Cleveland, OH 44134 and is currently estimated at $339,850, approximately $144 per square foot. 7031 E Parkview Dr is a home located in Cuyahoga County with nearby schools including Green Valley Elementary School, Hillside Middle School, and Normandy High School.
Ownership History
Date
Name
Owned For
Owner Type
Purchase Details
Closed on
Jan 8, 2001
Sold by
Everett Marlon J
Bought by
Tekalec Eric M and Tekalec Pauline
Current Estimated Value
Home Financials for this Owner
Home Financials are based on the most recent Mortgage that was taken out on this home.
Original Mortgage
$110,500
Interest Rate
7.22%
Purchase Details
Closed on
Feb 29, 2000
Sold by
Everett Jacqueline J
Bought by
Everett Marion J
Purchase Details
Closed on
May 22, 1995
Sold by
Monaco Wayne E
Bought by
Everett Marlon J and Everett Jacqueline M
Home Financials for this Owner
Home Financials are based on the most recent Mortgage that was taken out on this home.
Original Mortgage
$125,000
Interest Rate
8.42%
Mortgage Type
New Conventional
Purchase Details
Closed on
Oct 31, 1991
Bought by
Monaco Wayne E
Purchase Details
Closed on
Jan 1, 1990
Bought by
Hyman Bldg Inc
Create a Home Valuation Report for This Property
The Home Valuation Report is an in-depth analysis detailing your home's value as well as a comparison with similar homes in the area
Home Values in the Area
Average Home Value in this Area
Purchase History
| Date | Buyer | Sale Price | Title Company |
|---|---|---|---|
| Tekalec Eric M | $200,500 | Approved Statewide Title Age | |
| Everett Marion J | -- | -- | |
| Everett Marlon J | $176,000 | -- | |
| Monaco Wayne E | $164,500 | -- | |
| Hyman Bldg Inc | -- | -- |
Source: Public Records
Mortgage History
| Date | Status | Borrower | Loan Amount |
|---|---|---|---|
| Previous Owner | Tekalec Eric M | $110,500 | |
| Previous Owner | Everett Marlon J | $125,000 |
Source: Public Records
Tax History Compared to Growth
Tax History
| Year | Tax Paid | Tax Assessment Tax Assessment Total Assessment is a certain percentage of the fair market value that is determined by local assessors to be the total taxable value of land and additions on the property. | Land | Improvement |
|---|---|---|---|---|
| 2024 | $5,945 | $99,925 | $18,970 | $80,955 |
| 2023 | $5,103 | $73,610 | $14,840 | $58,770 |
| 2022 | $5,061 | $73,605 | $14,840 | $58,765 |
| 2021 | $5,212 | $73,610 | $14,840 | $58,770 |
| 2020 | $5,225 | $65,730 | $13,270 | $52,470 |
| 2019 | $5,035 | $187,800 | $37,900 | $149,900 |
| 2018 | $4,892 | $65,730 | $13,270 | $52,470 |
| 2017 | $4,899 | $59,370 | $12,500 | $46,870 |
| 2016 | $4,868 | $59,370 | $12,500 | $46,870 |
| 2015 | $4,839 | $59,370 | $12,500 | $46,870 |
| 2014 | $4,839 | $61,180 | $12,880 | $48,300 |
Source: Public Records
Map
Nearby Homes
- 1030 Guadalupe Dr
- 7004 Broadview Rd
- 375 Hillside Rd
- 2406 Park Dr
- 2410 Park Dr
- 1286 Cherry Ln
- 918 Starlight Dr
- 2644 Nottingham Dr
- 2838 Marda Dr
- 1691 E Parkhaven Dr
- 7180 Marko Ln
- 3011 Klusner Ave
- 1881 W Pleasant Valley Rd
- 433 Chestnut Rd
- 3195 Marda Dr
- 3200 Dentzler Rd
- 3262 Marda Dr
- 80 Panorama Dr
- 6800 Drexel Dr
- 223 Village Dr W
- 7041 E Parkview Dr
- 7021 E Parkview Dr
- 7011 E Parkview Dr
- 1220 Lourdes Dr
- 1200 Lourdes Dr
- 1240 Lourdes Dr
- 7051 E Parkview Dr
- 1180 Lourdes Dr
- 1260 Lourdes Dr
- 7001 E Parkview Dr
- 1445 Fatima Dr
- 7020 E E Parkview
- 7020 E Parkview Dr
- 7010 E Parkview Dr
- 7061 E Parkview Dr
- 1465 Fatima Dr
- 1280 Lourdes Dr
- 6991 E Parkview Dr
- 1160 Lourdes Dr
- 7000 E Parkview Dr