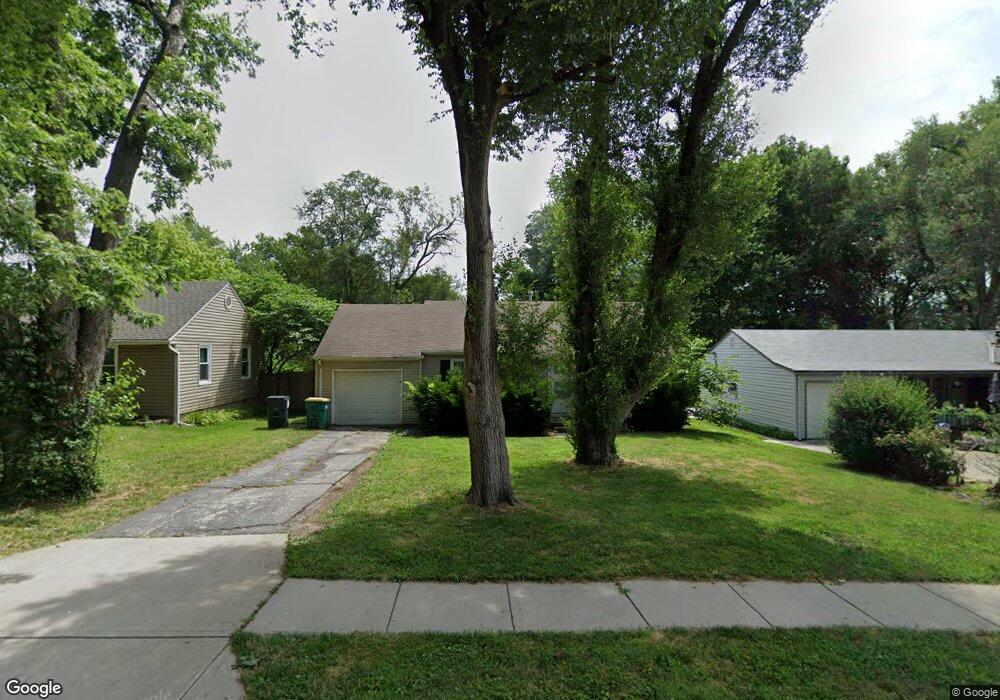
7031 Horton St Overland Park, KS 66204
Estimated Value: $256,000 - $286,000
2
Beds
1
Bath
768
Sq Ft
$349/Sq Ft
Est. Value
About This Home
This home is located at 7031 Horton St, Overland Park, KS 66204 and is currently estimated at $268,071, approximately $349 per square foot. 7031 Horton St is a home located in Johnson County with nearby schools including Santa Fe Trail Elementary School, Hocker Grove Middle School, and Shawnee Mission North High School.
Ownership History
Date
Name
Owned For
Owner Type
Purchase Details
Closed on
Apr 16, 2018
Sold by
Evilsizer Scott Michael and Evilsizer Sonia
Bought by
E & W Properties Llc
Current Estimated Value
Home Financials for this Owner
Home Financials are based on the most recent Mortgage that was taken out on this home.
Original Mortgage
$116,000
Outstanding Balance
$99,804
Interest Rate
4.46%
Mortgage Type
Future Advance Clause Open End Mortgage
Estimated Equity
$168,267
Purchase Details
Closed on
Dec 20, 2017
Sold by
Wells Fargo Bank N A
Bought by
Evilsizer Scott Michael and Wadsworth Jeremy Scott
Purchase Details
Closed on
Feb 15, 2017
Sold by
Coppenbarger James
Bought by
Wells Fargo Bank Na
Purchase Details
Closed on
Mar 13, 2006
Sold by
Addington Jennifer K
Bought by
Coppenbarger James A
Home Financials for this Owner
Home Financials are based on the most recent Mortgage that was taken out on this home.
Original Mortgage
$87,200
Interest Rate
6.24%
Mortgage Type
New Conventional
Create a Home Valuation Report for This Property
The Home Valuation Report is an in-depth analysis detailing your home's value as well as a comparison with similar homes in the area
Home Values in the Area
Average Home Value in this Area
Purchase History
| Date | Buyer | Sale Price | Title Company |
|---|---|---|---|
| E & W Properties Llc | -- | None Available | |
| Evilsizer Scott Michael | -- | None Available | |
| Wells Fargo Bank Na | -- | None Available | |
| Coppenbarger James A | -- | None Available |
Source: Public Records
Mortgage History
| Date | Status | Borrower | Loan Amount |
|---|---|---|---|
| Open | E & W Properties Llc | $116,000 | |
| Previous Owner | Coppenbarger James A | $87,200 |
Source: Public Records
Tax History Compared to Growth
Tax History
| Year | Tax Paid | Tax Assessment Tax Assessment Total Assessment is a certain percentage of the fair market value that is determined by local assessors to be the total taxable value of land and additions on the property. | Land | Improvement |
|---|---|---|---|---|
| 2024 | $2,767 | $29,095 | $7,411 | $21,684 |
| 2023 | $2,733 | $28,094 | $6,741 | $21,353 |
| 2022 | $2,512 | $26,024 | $6,128 | $19,896 |
| 2021 | $2,512 | $21,655 | $5,572 | $16,083 |
| 2020 | $2,041 | $20,056 | $4,457 | $15,599 |
| 2019 | $1,769 | $17,411 | $2,980 | $14,431 |
| 2018 | $1,729 | $16,951 | $2,980 | $13,971 |
| 2017 | $1,585 | $15,307 | $2,980 | $12,327 |
| 2016 | $1,473 | $14,007 | $2,980 | $11,027 |
| 2015 | $1,375 | $13,375 | $2,980 | $10,395 |
| 2013 | -- | $12,754 | $2,980 | $9,774 |
Source: Public Records
Map
Nearby Homes
- 7041 Russell St
- 6923 Beverly St
- 6913 Dearborn St
- 6928 Russell St
- 7115 Outlook St
- 6515 W 69th St
- 7041 Glenwood St
- 7231 Outlook St
- 6708 W 72nd Terrace
- 5919 W 74th St
- 6941 Nall Ave
- 5409 W 69th Terrace
- 6815 W 73rd St
- 5215 W 71st Terrace
- 5219 W 70th St
- 5213 W 70th Terrace
- 5303 W 72nd Terrace
- 6710 Broadmoor St
- 5202 W 72nd Terrace
- 5911 W 75th Terrace
- 7025 Horton St
- 7035 Horton St
- 7021 Horton St
- 7039 Horton St
- 7032 Beverly St
- 7022 Beverly St
- 7015 Horton St
- 7043 Horton St
- 7036 Beverly St
- 7018 Beverly St
- 7030 Horton St
- 7024 Horton St
- 7034 Horton St
- 7038 Horton St
- 7020 Horton St
- 7040 Beverly St
- 7012 Beverly St
- 7011 Horton St
- 7049 Horton St
- 7042 Horton St