Estimated Value: $370,000 - $404,000
4
Beds
3
Baths
2,212
Sq Ft
$172/Sq Ft
Est. Value
About This Home
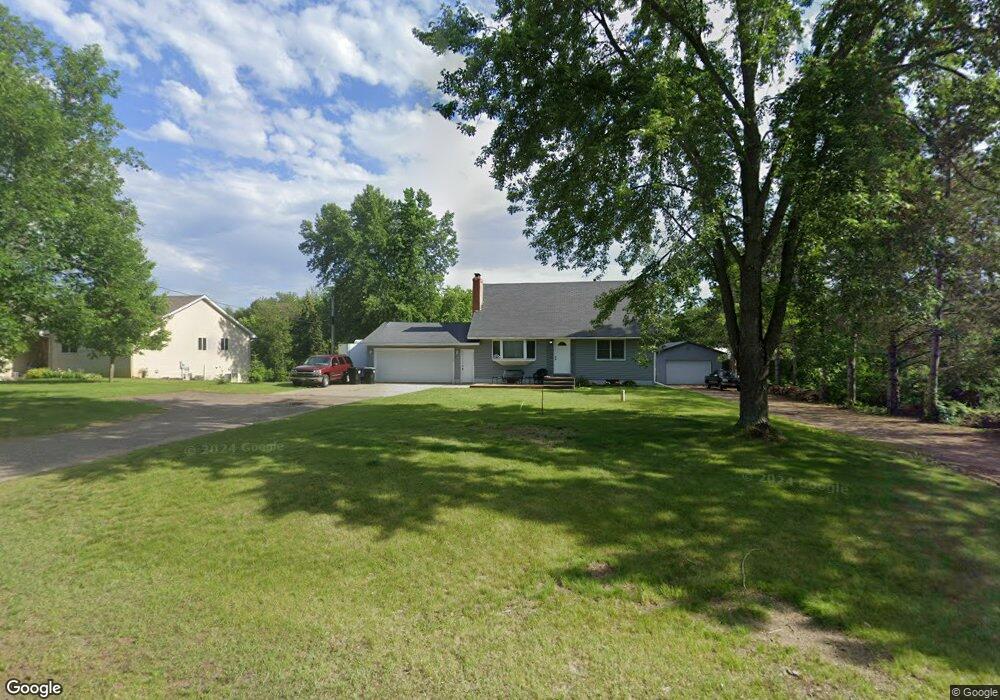
This home is located at 7036 156th Ave NW, Anoka, MN 55303 and is currently estimated at $379,986, approximately $171 per square foot. 7036 156th Ave NW is a home located in Anoka County with nearby schools including Brookside Elementary School, Anoka Middle School for the Arts - Fred Moor Campus, and Anoka Senior High School.
Ownership History
Date
Name
Owned For
Owner Type
Purchase Details
Closed on
Jan 1, 2019
Sold by
Harrison Amy C
Bought by
Nichols Jake and Anderson Amanda
Current Estimated Value
Home Financials for this Owner
Home Financials are based on the most recent Mortgage that was taken out on this home.
Original Mortgage
$220,924
Outstanding Balance
$197,620
Interest Rate
5.5%
Mortgage Type
FHA
Estimated Equity
$182,366
Purchase Details
Closed on
Oct 4, 2010
Sold by
Us Bank Na
Bought by
Harrison Amy C
Home Financials for this Owner
Home Financials are based on the most recent Mortgage that was taken out on this home.
Original Mortgage
$117,418
Interest Rate
4.4%
Mortgage Type
FHA
Purchase Details
Closed on
Jul 22, 2005
Sold by
Kalk Fred R and Kalk Rose M
Bought by
Herberg Mark A
Home Financials for this Owner
Home Financials are based on the most recent Mortgage that was taken out on this home.
Original Mortgage
$168,000
Interest Rate
5.37%
Mortgage Type
Adjustable Rate Mortgage/ARM
Create a Home Valuation Report for This Property
The Home Valuation Report is an in-depth analysis detailing your home's value as well as a comparison with similar homes in the area
Home Values in the Area
Average Home Value in this Area
Purchase History
| Date | Buyer | Sale Price | Title Company |
|---|---|---|---|
| Nichols Jake | $225,000 | Lakeside Title Inc | |
| Harrison Amy C | $119,000 | -- | |
| Herberg Mark A | $210,000 | -- |
Source: Public Records
Mortgage History
| Date | Status | Borrower | Loan Amount |
|---|---|---|---|
| Open | Nichols Jake | $220,924 | |
| Previous Owner | Harrison Amy C | $117,418 | |
| Previous Owner | Herberg Mark A | $168,000 |
Source: Public Records
Tax History Compared to Growth
Tax History
| Year | Tax Paid | Tax Assessment Tax Assessment Total Assessment is a certain percentage of the fair market value that is determined by local assessors to be the total taxable value of land and additions on the property. | Land | Improvement |
|---|---|---|---|---|
| 2025 | $3,732 | $334,900 | $110,500 | $224,400 |
| 2024 | $3,732 | $340,500 | $116,000 | $224,500 |
| 2023 | $3,376 | $336,900 | $100,500 | $236,400 |
| 2022 | $3,104 | $330,400 | $88,400 | $242,000 |
| 2021 | $2,752 | $270,400 | $75,500 | $194,900 |
| 2020 | $2,855 | $249,200 | $66,700 | $182,500 |
| 2019 | $2,732 | $245,500 | $57,800 | $187,700 |
| 2018 | $2,618 | $221,500 | $0 | $0 |
| 2017 | $2,440 | $204,700 | $0 | $0 |
| 2016 | $2,448 | $184,900 | $0 | $0 |
| 2015 | $2,423 | $184,900 | $57,100 | $127,800 |
| 2014 | -- | $159,200 | $46,400 | $112,800 |
Source: Public Records
Map
Nearby Homes
- 7025 156th Ave NW
- TBD 158th Ln NW
- 15985 Sapphire St NW
- 7321 151st Ave NW
- 7411 151st Ln NW
- 7531 152nd Ave NW
- 16140 Jasper St NW
- 16327 Marble St NW
- 7080 148th Ave NW
- 7041 147th Ln NW
- 14754 Peridot St NW
- 7720 150th Ln NW
- 7369 147th Ln NW
- 7354 147th Ln NW
- 7437 147th Ln NW
- 14843 Willemite St NW
- 14853 Willemite St NW
- 14841 Willemite St NW
- 15495 Sodium St NW
- 14652 Peridot Terrace NW
- 7018 156th Ave NW
- 7041 156th Ave NW
- 7005 156th Ave NW
- 6960 156th Ave NW
- 6955 156th Ave NW
- 15651 Ramsey Blvd NW
- 7130 156th Ave NW
- 0000 Alpine Dr
- 7141 156th Ave NW
- 6912 156th Ave NW
- 15665 Ramsey Blvd NW
- 15631 Ramsey Blvd NW
- 15523 Ramsey Blvd NW
- 15505 Ramsey Blvd NW
- 6921 156th Ave NW
- 7040 157th Ln NW
- 7020 157th Ln NW
- 7000 157th Ln NW
- 15401 Ramsey Blvd NW
- 15443 Ramsey Blvd NW