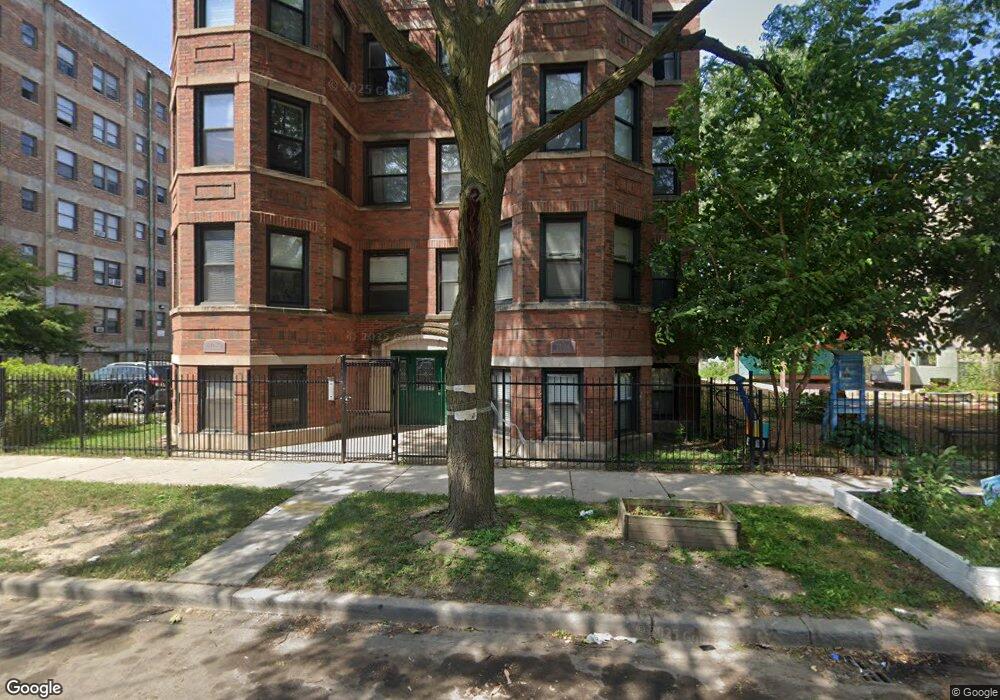
7036 S Merrill Ave Unit 7036G Chicago, IL 60649
South Shore NeighborhoodEstimated Value: $66,000 - $95,000
2
Beds
1
Bath
1,000
Sq Ft
$81/Sq Ft
Est. Value
About This Home
This home is located at 7036 S Merrill Ave Unit 7036G, Chicago, IL 60649 and is currently estimated at $81,465, approximately $81 per square foot. 7036 S Merrill Ave Unit 7036G is a home located in Cook County with nearby schools including Okeeffe Elementary School and St Philip Neri Elementary School.
Ownership History
Date
Name
Owned For
Owner Type
Purchase Details
Closed on
Oct 15, 2024
Sold by
Nwim Llc
Bought by
Roby Terrence
Current Estimated Value
Home Financials for this Owner
Home Financials are based on the most recent Mortgage that was taken out on this home.
Original Mortgage
$58,200
Outstanding Balance
$57,673
Interest Rate
7.13%
Mortgage Type
New Conventional
Estimated Equity
$23,792
Purchase Details
Closed on
Jan 31, 2012
Sold by
Asiegbu Rosemary
Bought by
Nwim Llc
Purchase Details
Closed on
Mar 29, 2010
Sold by
Howse Tiffany
Bought by
Asiegbu Rosemary
Purchase Details
Closed on
May 4, 2007
Sold by
Lsk Merrill Llc
Bought by
Howse Tiffany
Home Financials for this Owner
Home Financials are based on the most recent Mortgage that was taken out on this home.
Original Mortgage
$125,000
Interest Rate
6.2%
Mortgage Type
Purchase Money Mortgage
Create a Home Valuation Report for This Property
The Home Valuation Report is an in-depth analysis detailing your home's value as well as a comparison with similar homes in the area
Home Values in the Area
Average Home Value in this Area
Purchase History
| Date | Buyer | Sale Price | Title Company |
|---|---|---|---|
| Roby Terrence | $60,000 | None Listed On Document | |
| Nwim Llc | -- | None Available | |
| Asiegbu Rosemary | $34,000 | Stewart Title Company | |
| Howse Tiffany | $125,000 | Ct |
Source: Public Records
Mortgage History
| Date | Status | Borrower | Loan Amount |
|---|---|---|---|
| Open | Roby Terrence | $58,200 | |
| Previous Owner | Howse Tiffany | $125,000 |
Source: Public Records
Tax History Compared to Growth
Tax History
| Year | Tax Paid | Tax Assessment Tax Assessment Total Assessment is a certain percentage of the fair market value that is determined by local assessors to be the total taxable value of land and additions on the property. | Land | Improvement |
|---|---|---|---|---|
| 2024 | $317 | $6,825 | $805 | $6,020 |
| 2023 | $308 | $1,501 | $650 | $851 |
| 2022 | $308 | $1,501 | $650 | $851 |
| 2021 | $301 | $1,499 | $649 | $850 |
| 2020 | $1,485 | $6,665 | $649 | $6,016 |
| 2019 | $1,474 | $7,338 | $649 | $6,689 |
| 2018 | $1,812 | $9,173 | $649 | $8,524 |
| 2017 | $1,856 | $8,623 | $571 | $8,052 |
| 2016 | $1,727 | $8,623 | $571 | $8,052 |
| 2015 | $1,580 | $8,623 | $571 | $8,052 |
| 2014 | $1,406 | $7,580 | $467 | $7,113 |
| 2013 | $1,379 | $7,580 | $467 | $7,113 |
Source: Public Records
Map
Nearby Homes
- 7018 S Paxton Ave Unit 3N
- 7000 S Paxton Ave Unit 1N
- 7025 S Chappel Ave
- 2212 E 70th St Unit 3A
- 2212 E 70th St Unit 2D
- 2230 E 70th Place Unit 204
- 2234 E 70th Place Unit 1
- 2315 E 70th Place Unit 213
- 2019 E 72nd Place
- 2306 E 71st St Unit B
- 2043 E 72nd St Unit 1C
- 6911 S Jeffery Blvd
- 2052 E 69th St Unit 1B
- 2032 E 72nd Place Unit 2E
- 2348 E 71st St Unit P18
- 2348 E 71st St Unit P-44
- 2030 E 72nd Place Unit 3D
- 6922 S Jeffery Blvd Unit 5N
- 6943 S Euclid Ave
- 2115 E 72nd Place
- 7036 S Merrill Ave Unit 70362
- 7036 S Merrill Ave Unit 70363
- 7036 S Merrill Ave Unit 70361
- 7036 S Merrill Ave Unit NG
- 7036 S Merrill Ave Unit G
- 7036 S Merrill Ave Unit 2
- 7036 S Merrill Ave Unit GN
- 7036 S Merrill Ave Unit 3
- 7036 S Merrill Ave Unit 1
- 7038 S Merrill Ave Unit 3
- 7038 S Merrill Ave Unit 70383
- 7038 S Merrill Ave Unit 70382
- 7038 S Merrill Ave Unit 70381
- 7038 S Merrill Ave Unit 7038G
- 7038 S Merrill Ave Unit G
- 7038 S Merrill Ave Unit 1
- 7028 S Merrill Ave
- 7028 S Merrill Ave Unit 3S
- 7028 S Merrill Ave Unit 1S
- 7036-7038 S Merrill Ave