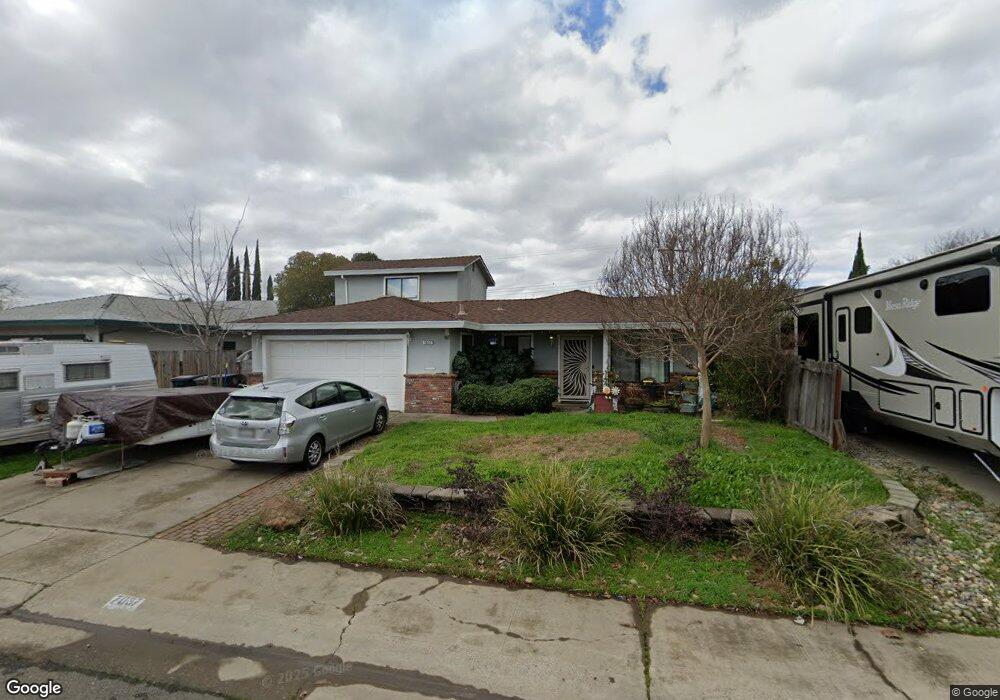
7037 Durham St Citrus Heights, CA 95621
Estimated Value: $341,000 - $511,000
3
Beds
2
Baths
1,691
Sq Ft
$273/Sq Ft
Est. Value
About This Home
This home is located at 7037 Durham St, Citrus Heights, CA 95621 and is currently estimated at $462,424, approximately $273 per square foot. 7037 Durham St is a home located in Sacramento County with nearby schools including Arlington Heights Elementary School, Sylvan Middle School, and Mesa Verde High School.
Ownership History
Date
Name
Owned For
Owner Type
Purchase Details
Closed on
Oct 14, 2021
Sold by
Richardson Alycia R and Blackstone David S
Bought by
Richardson Alycia R and Blackstone David S
Current Estimated Value
Home Financials for this Owner
Home Financials are based on the most recent Mortgage that was taken out on this home.
Original Mortgage
$335,700
Outstanding Balance
$306,127
Interest Rate
2.8%
Mortgage Type
New Conventional
Estimated Equity
$156,297
Purchase Details
Closed on
Jun 25, 2018
Sold by
Miskell George L and Miskell Annette J
Bought by
Blackstone David S and Richardson Alycia R
Home Financials for this Owner
Home Financials are based on the most recent Mortgage that was taken out on this home.
Original Mortgage
$314,204
Interest Rate
5.12%
Mortgage Type
FHA
Create a Home Valuation Report for This Property
The Home Valuation Report is an in-depth analysis detailing your home's value as well as a comparison with similar homes in the area
Home Values in the Area
Average Home Value in this Area
Purchase History
| Date | Buyer | Sale Price | Title Company |
|---|---|---|---|
| Richardson Alycia R | -- | Fidelity National Title Co | |
| Richardson Alycia R | -- | Fidelity National Title Co | |
| Blackstone David S | $320,000 | Fidelity National Title Comp |
Source: Public Records
Mortgage History
| Date | Status | Borrower | Loan Amount |
|---|---|---|---|
| Open | Richardson Alycia R | $335,700 | |
| Closed | Richardson Alycia R | $335,700 | |
| Closed | Blackstone David S | $314,204 |
Source: Public Records
Tax History Compared to Growth
Tax History
| Year | Tax Paid | Tax Assessment Tax Assessment Total Assessment is a certain percentage of the fair market value that is determined by local assessors to be the total taxable value of land and additions on the property. | Land | Improvement |
|---|---|---|---|---|
| 2025 | $4,237 | $359,191 | $89,238 | $269,953 |
| 2024 | $4,237 | $352,149 | $87,489 | $264,660 |
| 2023 | $4,130 | $345,245 | $85,774 | $259,471 |
| 2022 | $4,108 | $338,477 | $84,093 | $254,384 |
| 2021 | $4,040 | $331,842 | $82,445 | $249,397 |
| 2020 | $3,965 | $328,440 | $81,600 | $246,840 |
| 2019 | $3,885 | $322,000 | $80,000 | $242,000 |
| 2018 | $1,517 | $131,081 | $32,967 | $98,114 |
| 2017 | $1,501 | $128,512 | $32,321 | $96,191 |
| 2016 | $1,401 | $125,993 | $31,688 | $94,305 |
| 2015 | $1,376 | $124,102 | $31,213 | $92,889 |
| 2014 | $1,346 | $121,672 | $30,602 | $91,070 |
Source: Public Records
Map
Nearby Homes
- 6829 Kittery Ave
- 7105 Ansley Ct
- 6862 Westchester Way
- 6936 Winlock Ave
- 6912 van Maren Ln
- 6924 Trailride Way
- 7136 Baranga Dr
- 7409 Circlet Way
- 7101 van Maren Ln
- 6838 Susanna Ct
- 7116 Grenola Way
- 6821 Susanna Ct
- 7215 Coronet Ct
- 6917 Vera Cruz Ct
- 6752 Bertran Ct
- 6608 Trailride Way
- 7255 Minuet Way
- 7006 Enright Dr
- 7205 Princess Ct
- 7059 San Jacinto Ct
- 7033 Durham St
- 7041 Durham St
- 7040 Cobalt Way
- 7029 Durham St
- 7044 Cobalt Way
- 7036 Cobalt Way
- 7040 Durham St
- 6826 Winlock Ave
- 6822 Winlock Ave
- 7044 Durham St
- 7036 Durham St
- 7032 Cobalt Way
- 7025 Durham St
- 6818 Winlock Ave
- 7032 Durham St
- 6900 Winlock Ave
- 7028 Cobalt Way
- 7028 Durham St
- 7021 Durham St
- 7029 Pippin Way