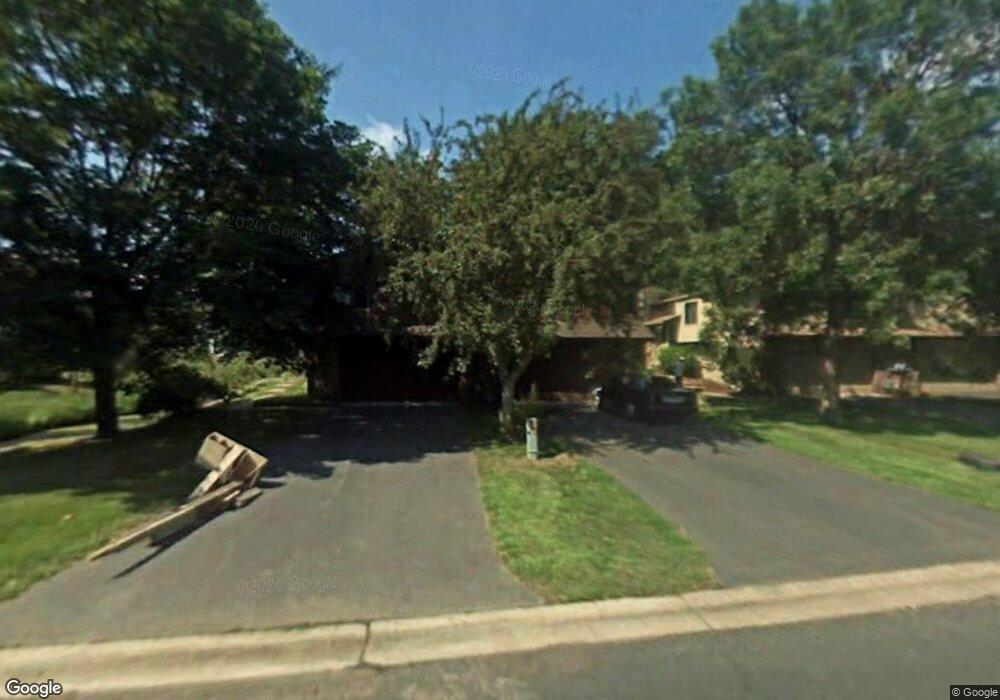
7037 Unity Ave N Brooklyn Center, MN 55429
Willow Lane NeighborhoodEstimated Value: $222,000 - $232,000
2
Beds
2
Baths
924
Sq Ft
$246/Sq Ft
Est. Value
About This Home
This home is located at 7037 Unity Ave N, Brooklyn Center, MN 55429 and is currently estimated at $227,356, approximately $246 per square foot. 7037 Unity Ave N is a home located in Hennepin County with nearby schools including Zanewood Community School, North View Middle School, and Park Center Senior High.
Ownership History
Date
Name
Owned For
Owner Type
Purchase Details
Closed on
May 12, 2016
Sold by
Proctor Kevin J and Springer Lee E
Bought by
Lee Pao
Current Estimated Value
Home Financials for this Owner
Home Financials are based on the most recent Mortgage that was taken out on this home.
Original Mortgage
$129,510
Outstanding Balance
$104,616
Interest Rate
4.12%
Mortgage Type
FHA
Estimated Equity
$122,740
Purchase Details
Closed on
Mar 9, 2012
Sold by
Springer Lee E
Bought by
Proctor Kevin J and Springer Lee E
Purchase Details
Closed on
Oct 18, 2011
Sold by
Savageau Stacey and Savageau Joshua
Bought by
Springer Lee E
Home Financials for this Owner
Home Financials are based on the most recent Mortgage that was taken out on this home.
Original Mortgage
$79,921
Interest Rate
4.4%
Mortgage Type
FHA
Purchase Details
Closed on
Mar 16, 2011
Sold by
Hsbc Mortgage Services Inc
Bought by
Savageau Stacey
Purchase Details
Closed on
May 5, 2005
Sold by
Steinbach Shane
Bought by
Taylor Dearis
Purchase Details
Closed on
Oct 31, 2000
Sold by
Hargett Dennis D
Bought by
Steinbach Shane D
Create a Home Valuation Report for This Property
The Home Valuation Report is an in-depth analysis detailing your home's value as well as a comparison with similar homes in the area
Home Values in the Area
Average Home Value in this Area
Purchase History
| Date | Buyer | Sale Price | Title Company |
|---|---|---|---|
| Lee Pao | $131,900 | Liberty Title Inc | |
| Proctor Kevin J | -- | None Available | |
| Springer Lee E | $82,000 | Liberty Title Inc | |
| Savageau Stacey | $42,000 | -- | |
| Taylor Dearis | $153,000 | -- | |
| Steinbach Shane D | $112,785 | -- |
Source: Public Records
Mortgage History
| Date | Status | Borrower | Loan Amount |
|---|---|---|---|
| Open | Lee Pao | $129,510 | |
| Previous Owner | Springer Lee E | $79,921 |
Source: Public Records
Tax History Compared to Growth
Tax History
| Year | Tax Paid | Tax Assessment Tax Assessment Total Assessment is a certain percentage of the fair market value that is determined by local assessors to be the total taxable value of land and additions on the property. | Land | Improvement |
|---|---|---|---|---|
| 2024 | $3,159 | $226,000 | $31,000 | $195,000 |
| 2023 | $3,035 | $219,200 | $30,000 | $189,200 |
| 2022 | $2,403 | $206,000 | $26,000 | $180,000 |
| 2021 | $2,397 | $181,000 | $26,000 | $155,000 |
| 2020 | $2,322 | $170,000 | $22,000 | $148,000 |
| 2019 | $2,234 | $161,000 | $22,000 | $139,000 |
| 2018 | $1,863 | $148,000 | $18,000 | $130,000 |
| 2017 | $1,339 | $98,500 | $20,500 | $78,000 |
| 2016 | $1,174 | $89,100 | $18,500 | $70,600 |
| 2015 | $1,084 | $83,800 | $18,500 | $65,300 |
| 2014 | -- | $76,600 | $17,600 | $59,000 |
Source: Public Records
Map
Nearby Homes
- 7073 Unity Ave N
- 5331 70th Cir N
- 5325 70th Cir N
- 6801 Toledo Ave N
- 6807 Quail Ave N
- 7308 Unity Ln N
- 7306 Brunswick Ave N
- 5729 75th Ln N
- 7317 Colorado Ave N
- 5224 65th Ave N
- 6419 Vera Cruz Ln N
- 7224 Florida Ave N
- 7041 Georgia Ave N
- 7640 Zane Ave N
- 5325 77th Ave N
- 6800 68th Ave N
- 6456 Edgewood Ave N
- 6413 Noble Ave N
- 4418 65th Ave N
- 6318 Perry Ave N
- 7037 Unity Ave N
- 7033 Unity Ave N
- 7033 7033 Unity-Avenue-n
- 7041 Unity Ave N
- 7045 Unity Ave N
- 7037 7037 Unity-Avenue-n
- 7049 Unity Ave N
- 7049 Unity Ave N
- 7045 7045 Unity-Avenue-n
- 7045 7045 Unity Ave N
- 7021 Unity Ave N
- 7053 Unity Ave N
- 7053 Unity Ave N
- 5431 70th Cir N
- 7017 Unity Ave N
- 7057 Unity Ave N
- 5430 70th Cir N
- 7057 7057 Unity-Avenue-n
- 5425 70th Cir N
- 7012 7012 Unity-Avenue-n