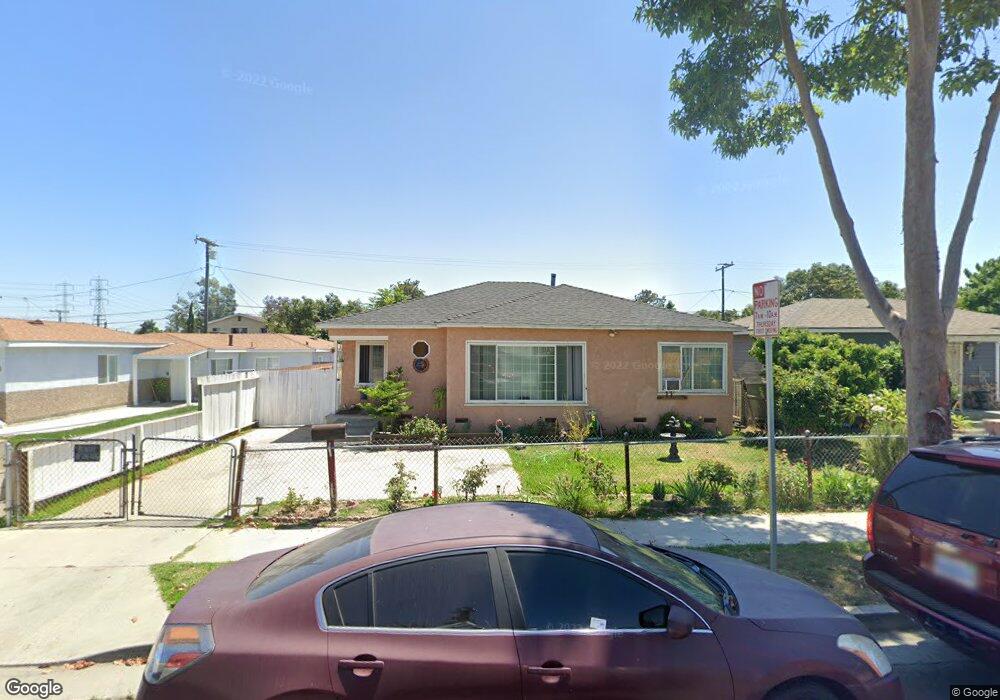
7038 San Juan St Paramount, CA 90723
Estimated Value: $610,093 - $721,000
3
Beds
1
Bath
1,241
Sq Ft
$536/Sq Ft
Est. Value
About This Home
This home is located at 7038 San Juan St, Paramount, CA 90723 and is currently estimated at $665,523, approximately $536 per square foot. 7038 San Juan St is a home located in Los Angeles County with nearby schools including Los Cerritos School, Frank J. Zamboni School, and Paramount High School.
Ownership History
Date
Name
Owned For
Owner Type
Purchase Details
Closed on
Nov 23, 2021
Sold by
Portiilo Mercedes Flores
Bought by
Portiilo Mercedes F and Mercedes F Portillo 2021 Revocable Trust
Current Estimated Value
Purchase Details
Closed on
Jun 20, 2017
Sold by
Flores Rosario
Bought by
Portillo Mercedes Flores
Purchase Details
Closed on
Nov 30, 1994
Sold by
Flores Rafael S and Flores Rafael
Bought by
Flores Rafael S
Purchase Details
Closed on
Jul 27, 1994
Sold by
Flores Fermin
Bought by
Flores Rafael
Purchase Details
Closed on
Mar 30, 1994
Sold by
Flores Rafael and Flores Rosario
Bought by
Flores Rafael
Home Financials for this Owner
Home Financials are based on the most recent Mortgage that was taken out on this home.
Original Mortgage
$71,000
Interest Rate
7.38%
Create a Home Valuation Report for This Property
The Home Valuation Report is an in-depth analysis detailing your home's value as well as a comparison with similar homes in the area
Home Values in the Area
Average Home Value in this Area
Purchase History
| Date | Buyer | Sale Price | Title Company |
|---|---|---|---|
| Portiilo Mercedes F | -- | None Available | |
| Portillo Mercedes Flores | -- | None Available | |
| Flores Rosario | -- | None Available | |
| Flores Rafael S | -- | -- | |
| Flores Rafael | -- | -- | |
| Flores Rafael | -- | Chicago Title Insurance Co |
Source: Public Records
Mortgage History
| Date | Status | Borrower | Loan Amount |
|---|---|---|---|
| Previous Owner | Flores Rafael | $71,000 |
Source: Public Records
Tax History Compared to Growth
Tax History
| Year | Tax Paid | Tax Assessment Tax Assessment Total Assessment is a certain percentage of the fair market value that is determined by local assessors to be the total taxable value of land and additions on the property. | Land | Improvement |
|---|---|---|---|---|
| 2025 | $1,967 | $116,358 | $38,245 | $78,113 |
| 2024 | $1,967 | $114,078 | $37,496 | $76,582 |
| 2023 | $1,935 | $111,842 | $36,761 | $75,081 |
| 2022 | $1,887 | $109,650 | $36,041 | $73,609 |
| 2021 | $1,842 | $107,501 | $35,335 | $72,166 |
| 2019 | $1,872 | $104,315 | $34,288 | $70,027 |
| 2018 | $1,691 | $102,270 | $33,616 | $68,654 |
| 2016 | $1,447 | $98,300 | $32,311 | $65,989 |
| 2015 | $1,377 | $96,824 | $31,826 | $64,998 |
| 2014 | $1,406 | $94,928 | $31,203 | $63,725 |
Source: Public Records
Map
Nearby Homes
- 6846 San Vincente St
- 6626 San Miguel St
- 7221 Petrol St Unit 6
- 7029 Somerset Blvd
- 7260 Richfield St Unit 318
- 7260 Richfield St Unit 305
- 6556 San Vincente St
- 15311 Gundry Ave Unit 2
- 15311 Gundry Ave Unit 16
- 15311 Gundry Ave Unit 29
- 15325 Orange Ave
- 15351 Orange Ave Unit 25
- 3 Rosecrans Ave
- 12323 Edgebrook Ave
- 5506 Pelleur St
- 7633 Racine Ave
- 7021 Alondra Blvd Unit 7
- 14005 Arthur Ave Unit 9
- 14121 Mcclure Ave
- 14708 S Frailey Ave
- 7044 San Juan St
- 7032 San Juan St
- 7026 San Juan St
- 7046 San Juan St
- 7037 San Miguel St
- 7041 San Miguel St
- 7033 San Miguel St
- 7022 San Juan St
- 7033 San Vincente St
- 7027 San Miguel St
- 7043 San Juan St
- 7039 San Juan St
- 7033 San Juan St
- 7023 San Miguel St
- 7049 San Miguel St
- 7016 San Juan St
- 7053 San Miguel St
- 7023 San Juan St
- 7017 San Juan St
- 7056 San Miguel St