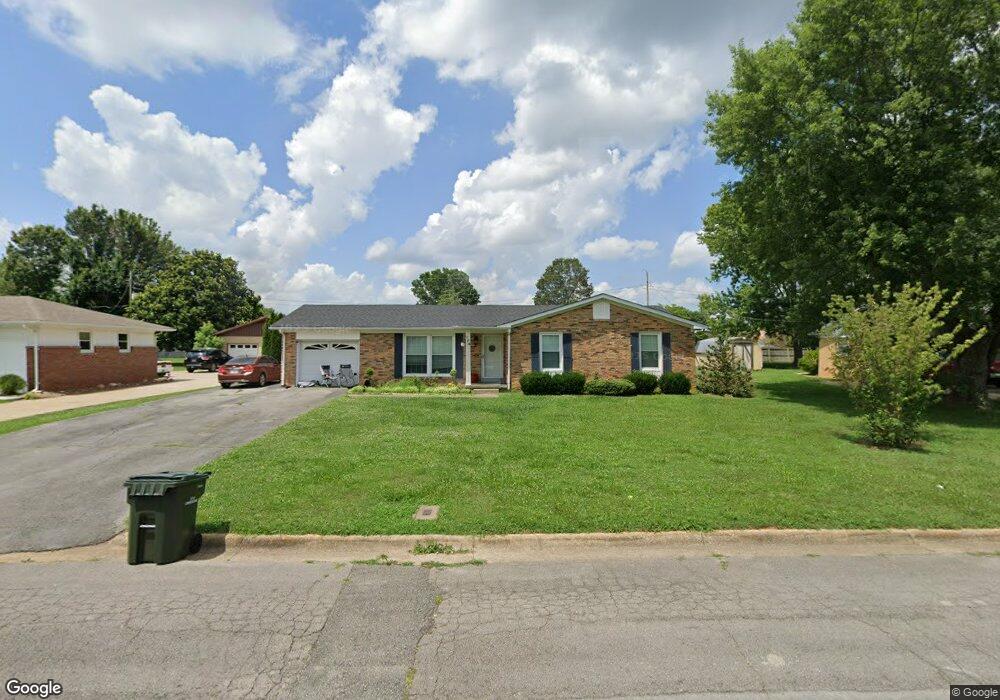
704 8th St Lawrenceburg, TN 38464
Estimated Value: $199,656 - $279,000
--
Bed
1
Bath
1,310
Sq Ft
$181/Sq Ft
Est. Value
About This Home
This home is located at 704 8th St, Lawrenceburg, TN 38464 and is currently estimated at $236,664, approximately $180 per square foot. 704 8th St is a home located in Lawrence County with nearby schools including Ingram Sowell Elementary School, Lawrenceburg Public Elementary School, and David Crockett Elementary School.
Ownership History
Date
Name
Owned For
Owner Type
Purchase Details
Closed on
Aug 20, 2020
Sold by
Kelly Jantz
Bought by
Crane Ray and Crane Jaclyn
Current Estimated Value
Home Financials for this Owner
Home Financials are based on the most recent Mortgage that was taken out on this home.
Original Mortgage
$145,000
Outstanding Balance
$128,335
Interest Rate
3%
Mortgage Type
Commercial
Estimated Equity
$108,329
Purchase Details
Closed on
Jul 13, 2020
Sold by
Kelly Jon and Kelly Joni
Bought by
Kelly Jantzen
Home Financials for this Owner
Home Financials are based on the most recent Mortgage that was taken out on this home.
Original Mortgage
$145,000
Outstanding Balance
$128,335
Interest Rate
3%
Mortgage Type
Commercial
Estimated Equity
$108,329
Purchase Details
Closed on
Nov 14, 2013
Sold by
Hughes Doris
Bought by
Kelly Jantzen and Kelly Jon
Purchase Details
Closed on
May 23, 1970
Bought by
Roberts Roy B and Ona Mae
Create a Home Valuation Report for This Property
The Home Valuation Report is an in-depth analysis detailing your home's value as well as a comparison with similar homes in the area
Home Values in the Area
Average Home Value in this Area
Purchase History
| Date | Buyer | Sale Price | Title Company |
|---|---|---|---|
| Crane Ray | $136,000 | None Available | |
| Kelly Jantzen | -- | None Available | |
| Kelly Jantzen | $64,000 | -- | |
| Roberts Roy B | -- | -- |
Source: Public Records
Mortgage History
| Date | Status | Borrower | Loan Amount |
|---|---|---|---|
| Open | Crane Ray | $145,000 |
Source: Public Records
Tax History Compared to Growth
Tax History
| Year | Tax Paid | Tax Assessment Tax Assessment Total Assessment is a certain percentage of the fair market value that is determined by local assessors to be the total taxable value of land and additions on the property. | Land | Improvement |
|---|---|---|---|---|
| 2025 | $1,261 | $40,575 | $0 | $0 |
| 2024 | $1,261 | $40,575 | $3,750 | $36,825 |
| 2023 | $1,261 | $40,575 | $3,750 | $36,825 |
| 2022 | $1,261 | $40,575 | $3,750 | $36,825 |
| 2021 | $1,315 | $29,925 | $2,500 | $27,425 |
| 2020 | $790 | $29,925 | $2,500 | $27,425 |
| 2019 | $790 | $17,975 | $2,500 | $15,475 |
| 2018 | $790 | $17,975 | $2,500 | $15,475 |
| 2017 | $790 | $17,975 | $2,500 | $15,475 |
| 2016 | $790 | $17,975 | $2,500 | $15,475 |
| 2015 | $748 | $17,975 | $2,500 | $15,475 |
| 2014 | $724 | $17,400 | $2,500 | $14,900 |
Source: Public Records
Map
Nearby Homes