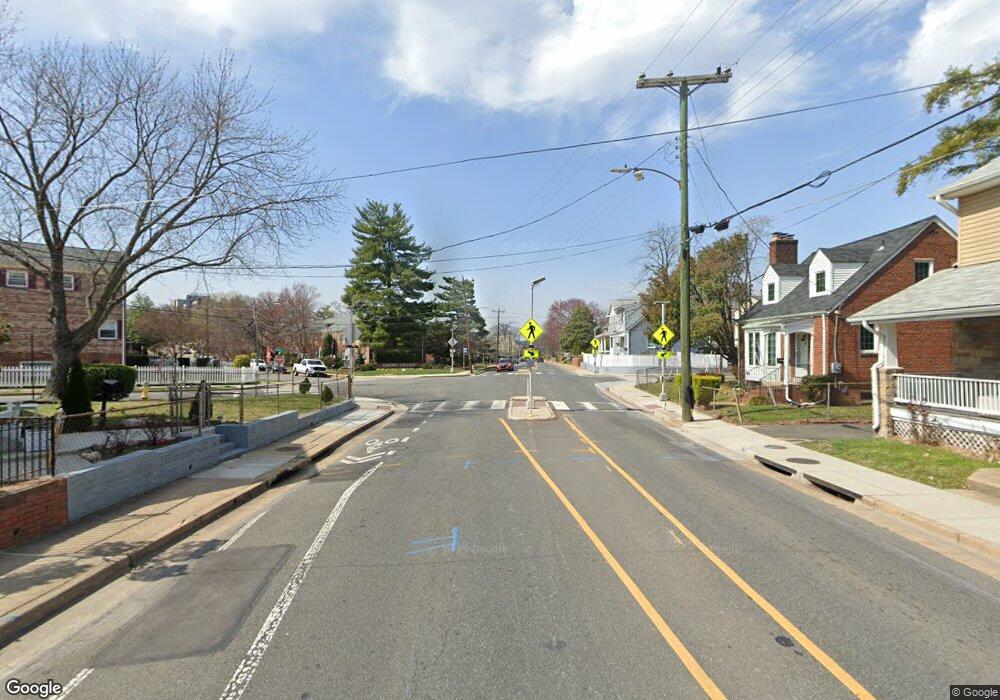
704-A W Glebe Rd Alexandria, VA 22305
Beverly Hills NeighborhoodEstimated Value: $499,000 - $579,077
--
Bed
1
Bath
1,122
Sq Ft
$480/Sq Ft
Est. Value
About This Home
This home is located at 704-A W Glebe Rd, Alexandria, VA 22305 and is currently estimated at $538,359, approximately $479 per square foot. 704-A W Glebe Rd is a home located in Alexandria City with nearby schools including Charles Barrett Elementary School, George Washington Middle School, and Alexandria City High School.
Ownership History
Date
Name
Owned For
Owner Type
Purchase Details
Closed on
Feb 16, 2024
Sold by
Mays Christopher and Lafontain Donna Marie
Bought by
Maslyn Austin and Behrmann Savannah
Current Estimated Value
Home Financials for this Owner
Home Financials are based on the most recent Mortgage that was taken out on this home.
Original Mortgage
$504,400
Outstanding Balance
$495,503
Interest Rate
6.62%
Mortgage Type
New Conventional
Estimated Equity
$42,856
Purchase Details
Closed on
Feb 24, 2000
Sold by
Skjel Stephen S
Bought by
Lafountain Donna M
Home Financials for this Owner
Home Financials are based on the most recent Mortgage that was taken out on this home.
Original Mortgage
$138,567
Interest Rate
8.15%
Mortgage Type
Purchase Money Mortgage
Create a Home Valuation Report for This Property
The Home Valuation Report is an in-depth analysis detailing your home's value as well as a comparison with similar homes in the area
Home Values in the Area
Average Home Value in this Area
Purchase History
| Date | Buyer | Sale Price | Title Company |
|---|---|---|---|
| Maslyn Austin | $520,000 | Mbh Settlement | |
| Lafountain Donna M | $135,850 | -- |
Source: Public Records
Mortgage History
| Date | Status | Borrower | Loan Amount |
|---|---|---|---|
| Open | Maslyn Austin | $504,400 | |
| Previous Owner | Lafountain Donna M | $138,567 |
Source: Public Records
Tax History Compared to Growth
Tax History
| Year | Tax Paid | Tax Assessment Tax Assessment Total Assessment is a certain percentage of the fair market value that is determined by local assessors to be the total taxable value of land and additions on the property. | Land | Improvement |
|---|---|---|---|---|
| 2025 | $5,578 | $500,063 | $267,375 | $232,688 |
| 2024 | $5,578 | $435,652 | $232,050 | $203,602 |
| 2023 | $4,737 | $426,793 | $227,500 | $199,293 |
| 2022 | $4,702 | $423,561 | $227,500 | $196,061 |
| 2021 | $4,487 | $404,243 | $216,800 | $187,443 |
| 2020 | $4,855 | $392,034 | $210,500 | $181,534 |
| 2019 | $4,340 | $384,084 | $206,500 | $177,584 |
| 2018 | $4,041 | $357,636 | $196,700 | $160,936 |
| 2017 | $3,935 | $348,242 | $190,000 | $158,242 |
| 2016 | $3,737 | $348,242 | $190,000 | $158,242 |
| 2015 | $3,632 | $348,242 | $190,000 | $158,242 |
| 2014 | $3,523 | $337,762 | $175,000 | $162,762 |
Source: Public Records
Map
Nearby Homes
- 464 W Glebe Rd
- 3836 Brighton Ct
- 3911 Old Dominion Blvd
- 3941 Old Dominion Blvd
- 904 W Glebe Rd
- 250 Aspen St
- 3306 Landover St
- 3203 Circle Hill Rd
- 210 Aspen St
- 31 W Reed Ave
- 2908 Argyle Dr
- 900 28th St S
- 2933 Landover St
- 3009 S Hill St
- 5 Kennedy St
- 2630 S Lynn St
- 2647 S Kent St
- 3519 Valley Dr
- 3614 Valley Dr
- 28 E Reed Ave
- 704 A W Glebe Rd W Unit A
- 704 W Glebe Rd
- 704 W Glebe Rd Unit A
- 706 W Glebe Rd
- 706 W Glebe Rd Unit A
- 706 Glebe Road A
- 706a W Glebe Rd
- 706-A W Glebe Rd
- 702 W Glebe Rd
- 702 W Glebe Rd Unit A
- 702-A W Glebe Rd
- 708-A W Glebe Rd
- 708 W Glebe Rd
- 708 W Glebe Rd Unit A
- 700 W Glebe Rd Unit A
- 700 W Glebe Rd
- 700 Glebe Road A W
- 700A W Glebe Rd
- 710-A W Glebe Rd
- 710 Glebe Road A