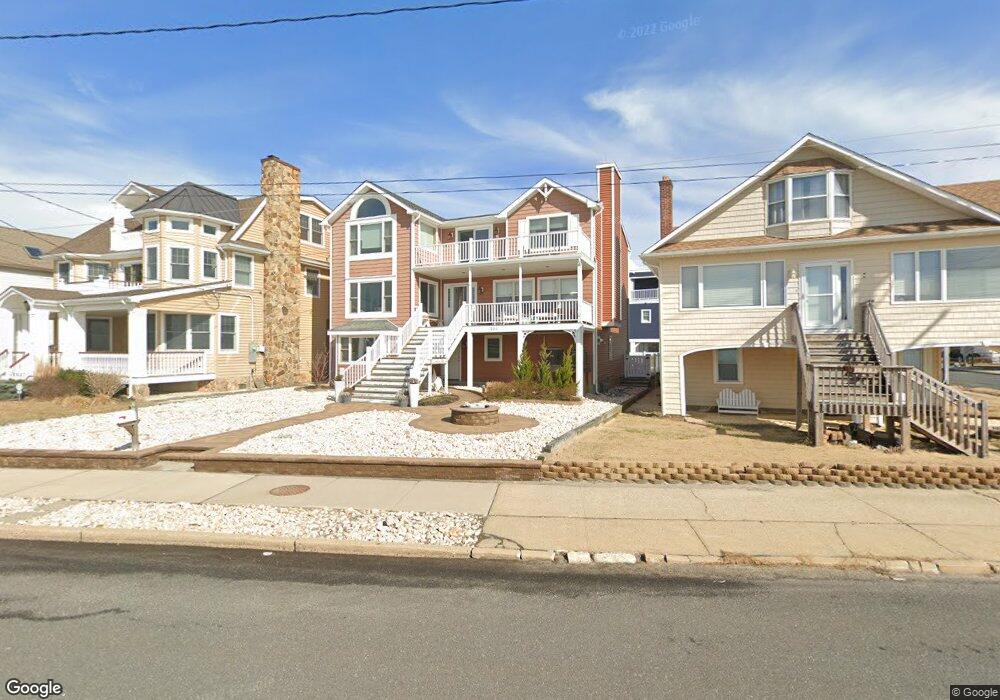
704 N Bayview Ave Seaside Park, NJ 08752
Estimated Value: $1,750,000 - $2,009,000
4
Beds
4
Baths
3,663
Sq Ft
$510/Sq Ft
Est. Value
About This Home
This home is located at 704 N Bayview Ave, Seaside Park, NJ 08752 and is currently estimated at $1,868,308, approximately $510 per square foot. 704 N Bayview Ave is a home located in Ocean County with nearby schools including Central Regional Middle School and Central Regional High School.
Ownership History
Date
Name
Owned For
Owner Type
Purchase Details
Closed on
Jun 22, 2006
Current Estimated Value
Home Financials for this Owner
Home Financials are based on the most recent Mortgage that was taken out on this home.
Original Mortgage
$898,200
Outstanding Balance
$518,555
Interest Rate
6.25%
Mortgage Type
Purchase Money Mortgage
Estimated Equity
$1,349,753
Purchase Details
Closed on
Apr 19, 2005
Sold by
The New Oceana Motel Llc
Bought by
Oceana Villas Llc
Purchase Details
Closed on
Aug 29, 1996
Sold by
Lands End Inc
Bought by
Becker Clifford and Becker Mildred Alice
Home Financials for this Owner
Home Financials are based on the most recent Mortgage that was taken out on this home.
Original Mortgage
$120,000
Interest Rate
8.11%
Create a Home Valuation Report for This Property
The Home Valuation Report is an in-depth analysis detailing your home's value as well as a comparison with similar homes in the area
Home Values in the Area
Average Home Value in this Area
Purchase History
| Date | Buyer | Sale Price | Title Company |
|---|---|---|---|
| -- | $561,400 | -- | |
| Becker Scott W | $1,122,750 | None Available | |
| Oceana Villas Llc | $2,125,000 | Lawyers Title Ins | |
| Becker Clifford | $166,500 | -- |
Source: Public Records
Mortgage History
| Date | Status | Borrower | Loan Amount |
|---|---|---|---|
| Open | Becker Scott W | $898,200 | |
| Previous Owner | Becker Clifford | $120,000 |
Source: Public Records
Tax History Compared to Growth
Tax History
| Year | Tax Paid | Tax Assessment Tax Assessment Total Assessment is a certain percentage of the fair market value that is determined by local assessors to be the total taxable value of land and additions on the property. | Land | Improvement |
|---|---|---|---|---|
| 2025 | $14,153 | $865,100 | $593,600 | $271,500 |
| 2024 | $13,919 | $865,100 | $593,600 | $271,500 |
| 2023 | $13,426 | $865,100 | $593,600 | $271,500 |
| 2022 | $13,426 | $865,100 | $593,600 | $271,500 |
| 2021 | $13,141 | $865,100 | $593,600 | $271,500 |
| 2020 | $13,002 | $865,100 | $593,600 | $271,500 |
| 2019 | $12,864 | $865,100 | $593,600 | $271,500 |
| 2018 | $12,025 | $865,100 | $593,600 | $271,500 |
| 2017 | $12,207 | $865,100 | $593,600 | $271,500 |
| 2016 | $11,350 | $865,100 | $593,600 | $271,500 |
| 2015 | $11,843 | $865,100 | $593,600 | $271,500 |
| 2014 | $11,316 | $865,100 | $593,600 | $271,500 |
Source: Public Records
Map
Nearby Homes