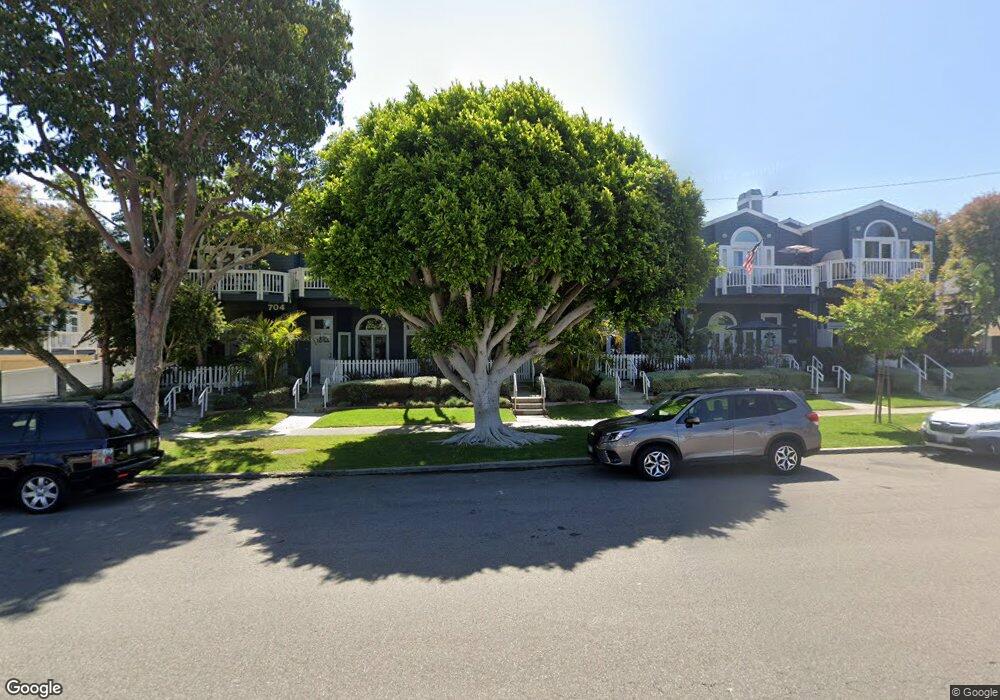
704 S Broadway Unit I Redondo Beach, CA 90277
Estimated Value: $1,558,963 - $1,742,000
3
Beds
3
Baths
1,926
Sq Ft
$850/Sq Ft
Est. Value
About This Home
This home is located at 704 S Broadway Unit I, Redondo Beach, CA 90277 and is currently estimated at $1,637,241, approximately $850 per square foot. 704 S Broadway Unit I is a home located in Los Angeles County with nearby schools including Alta Vista Elementary School, Parras (Nick G.) Middle School, and Redondo Union High School.
Ownership History
Date
Name
Owned For
Owner Type
Purchase Details
Closed on
Aug 9, 2013
Sold by
Hipolito Raedel C
Bought by
Lee Raymond and Hipolito Richel M
Current Estimated Value
Home Financials for this Owner
Home Financials are based on the most recent Mortgage that was taken out on this home.
Original Mortgage
$660,000
Outstanding Balance
$478,012
Interest Rate
3.75%
Mortgage Type
New Conventional
Estimated Equity
$1,159,229
Purchase Details
Closed on
May 9, 2005
Sold by
Jackson Karen
Bought by
Hipolito Raedel C
Home Financials for this Owner
Home Financials are based on the most recent Mortgage that was taken out on this home.
Original Mortgage
$656,800
Interest Rate
6%
Mortgage Type
New Conventional
Create a Home Valuation Report for This Property
The Home Valuation Report is an in-depth analysis detailing your home's value as well as a comparison with similar homes in the area
Home Values in the Area
Average Home Value in this Area
Purchase History
| Date | Buyer | Sale Price | Title Company |
|---|---|---|---|
| Lee Raymond | -- | North American Title Company | |
| Hipolito Raedel C | $821,000 | Chicago Title |
Source: Public Records
Mortgage History
| Date | Status | Borrower | Loan Amount |
|---|---|---|---|
| Open | Lee Raymond | $660,000 | |
| Closed | Hipolito Raedel C | $656,800 |
Source: Public Records
Tax History Compared to Growth
Tax History
| Year | Tax Paid | Tax Assessment Tax Assessment Total Assessment is a certain percentage of the fair market value that is determined by local assessors to be the total taxable value of land and additions on the property. | Land | Improvement |
|---|---|---|---|---|
| 2025 | $10,116 | $1,073,252 | $814,572 | $258,680 |
| 2024 | $10,116 | $1,052,208 | $798,600 | $253,608 |
| 2023 | $11,681 | $1,031,578 | $782,942 | $248,636 |
| 2022 | $11,525 | $1,011,352 | $767,591 | $243,761 |
| 2021 | $11,287 | $991,523 | $752,541 | $238,982 |
| 2019 | $11,066 | $962,116 | $730,221 | $231,895 |
| 2018 | $10,800 | $943,252 | $715,903 | $227,349 |
| 2016 | $10,458 | $906,626 | $688,104 | $218,522 |
| 2015 | $10,264 | $893,009 | $677,769 | $215,240 |
| 2014 | $10,124 | $875,517 | $664,493 | $211,024 |
Source: Public Records
Map
Nearby Homes
- 716 S Broadway Unit A
- 626 Elvira Ave
- 724 S Broadway Unit B
- 620 S Catalina Ave Unit C
- 625 Esplanade Unit 29
- 625 Esplanade Unit 4
- 641 S Gertruda Ave
- 615 Esplanade Unit 508
- 615 Esplanade Unit 512
- 515 S Broadway Unit B
- 510 S Catalina Ave Unit 2
- 575 Esplanade Unit 102
- 512 Esplanade Unit 303
- 555 Esplanade Unit 520
- 555 Esplanade Unit 320
- 555 Esplanade Unit 620
- 427 S Broadway
- 512 S Gertruda Ave
- 531 Esplanade Unit 713
- 531 Esplanade Unit 903
- 704 S Broadway Unit K
- 704 S Broadway
- 704 S Broadway Unit L
- 704 S Broadway
- 704 S Broadway Unit H
- 704 S Broadway Unit G
- 704 S Broadway Unit F
- 704 S Broadway Unit E
- 704 S Broadway Unit D
- 704 S Broadway Unit C
- 704 S Broadway Unit B
- 704 S Broadway Unit A
- 531 531 Esplanade Unit 903
- 710 S Broadway Unit C
- 710 S Broadway Unit B
- 710 S Broadway Unit A
- 702 S Broadway
- 702 S Broadway Unit B
- 702 S Broadway Unit C
- 702 S Broadway Unit B