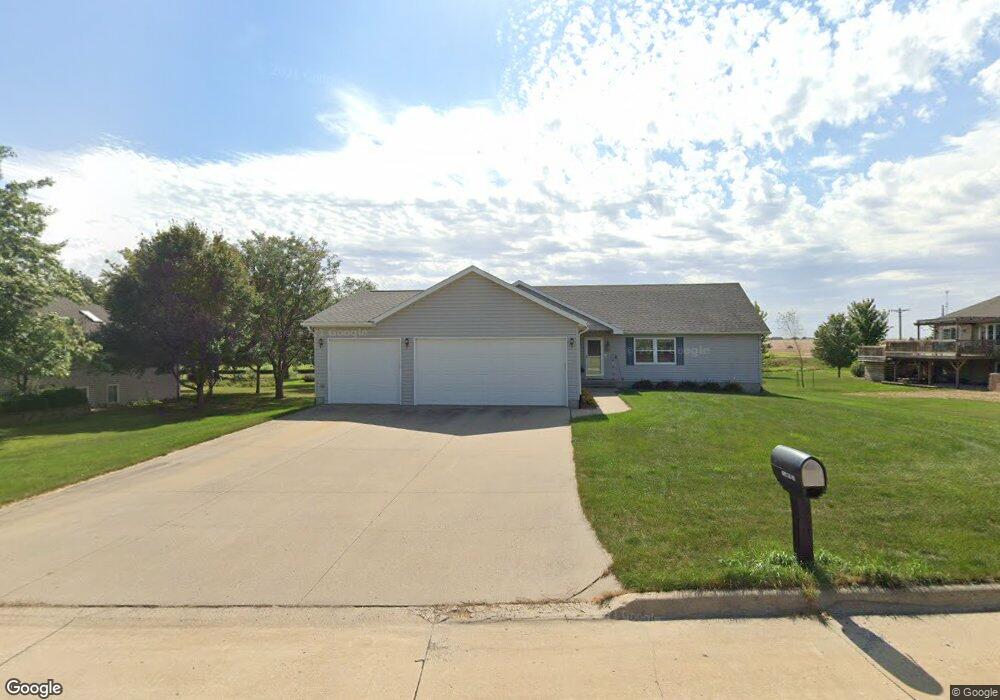
704 W 19th St Vinton, IA 52349
Estimated Value: $202,000 - $351,471
4
Beds
2
Baths
1,568
Sq Ft
$170/Sq Ft
Est. Value
About This Home
This home is located at 704 W 19th St, Vinton, IA 52349 and is currently estimated at $267,118, approximately $170 per square foot. 704 W 19th St is a home located in Benton County with nearby schools including Tilford Elementary School, Shellsburg Elementary School, and Vinton-Shellsburg Middle School.
Ownership History
Date
Name
Owned For
Owner Type
Purchase Details
Closed on
Aug 26, 2008
Sold by
Seemann Brian K and Seemann Carolyn
Bought by
Montgomery Nicholas W and Montgomery Lynn M
Current Estimated Value
Home Financials for this Owner
Home Financials are based on the most recent Mortgage that was taken out on this home.
Original Mortgage
$139,200
Outstanding Balance
$91,271
Interest Rate
6.31%
Mortgage Type
New Conventional
Estimated Equity
$175,847
Create a Home Valuation Report for This Property
The Home Valuation Report is an in-depth analysis detailing your home's value as well as a comparison with similar homes in the area
Home Values in the Area
Average Home Value in this Area
Purchase History
| Date | Buyer | Sale Price | Title Company |
|---|---|---|---|
| Montgomery Nicholas W | $174,000 | None Available |
Source: Public Records
Mortgage History
| Date | Status | Borrower | Loan Amount |
|---|---|---|---|
| Open | Montgomery Nicholas W | $139,200 |
Source: Public Records
Tax History Compared to Growth
Tax History
| Year | Tax Paid | Tax Assessment Tax Assessment Total Assessment is a certain percentage of the fair market value that is determined by local assessors to be the total taxable value of land and additions on the property. | Land | Improvement |
|---|---|---|---|---|
| 2025 | -- | $268,500 | $39,000 | $229,500 |
| 2024 | -- | $250,500 | $38,500 | $212,000 |
| 2023 | -- | $250,500 | $38,500 | $212,000 |
| 2022 | $0 | $205,800 | $30,800 | $175,000 |
| 2021 | $3,884 | $205,800 | $30,800 | $175,000 |
| 2020 | $3,884 | $191,600 | $25,900 | $165,700 |
| 2019 | $3,868 | $191,600 | $25,900 | $165,700 |
| 2018 | $3,750 | $188,200 | $25,000 | $163,200 |
| 2017 | $3,600 | $188,200 | $25,000 | $163,200 |
| 2016 | $3,536 | $175,900 | $23,400 | $152,500 |
| 2015 | $3,536 | $175,900 | $23,400 | $152,500 |
| 2014 | $3,758 | $185,800 | $0 | $0 |
Source: Public Records
Map
Nearby Homes