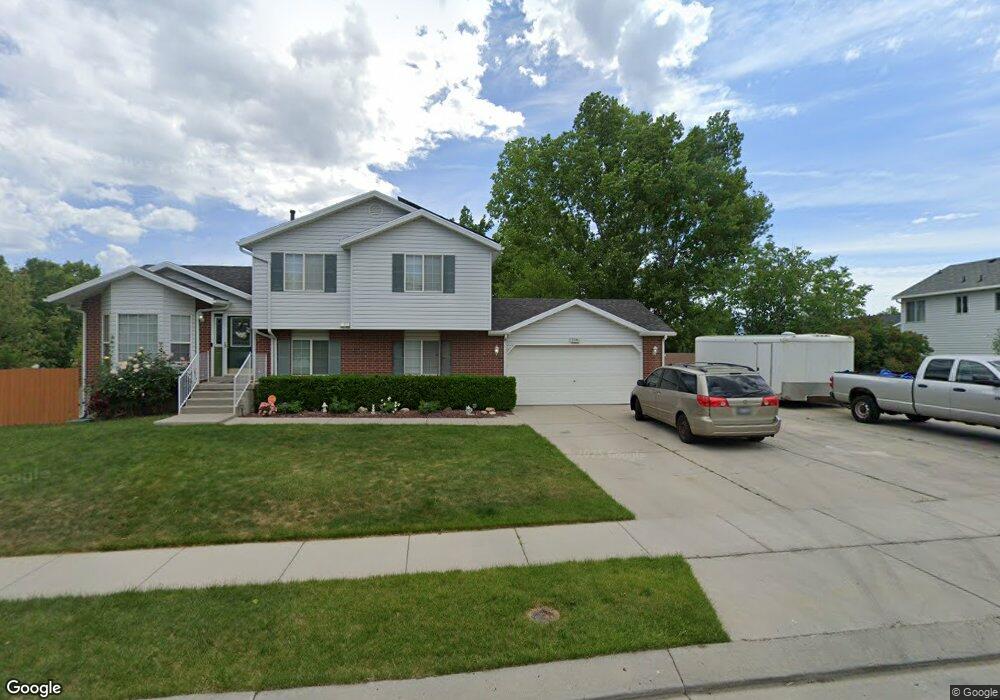
7041 Devonna Rd West Jordan, UT 84081
Shadow Mountain NeighborhoodEstimated Value: $511,265 - $583,000
3
Beds
2
Baths
2,101
Sq Ft
$257/Sq Ft
Est. Value
About This Home
This home is located at 7041 Devonna Rd, West Jordan, UT 84081 and is currently estimated at $539,066, approximately $256 per square foot. 7041 Devonna Rd is a home located in Salt Lake County with nearby schools including Mountain Shadows School, West Hills Middle School, and Copper Hills High School.
Ownership History
Date
Name
Owned For
Owner Type
Purchase Details
Closed on
Nov 21, 2003
Sold by
Doane Marcus L and Doane Mary L
Bought by
Richardson Stephen A and Richardson Laura F
Current Estimated Value
Home Financials for this Owner
Home Financials are based on the most recent Mortgage that was taken out on this home.
Original Mortgage
$124,000
Outstanding Balance
$53,952
Interest Rate
5.12%
Mortgage Type
Purchase Money Mortgage
Estimated Equity
$485,114
Purchase Details
Closed on
Dec 27, 2000
Sold by
Hud
Bought by
Doane Marcus L and Doane Mary L
Purchase Details
Closed on
Sep 12, 2000
Sold by
Wells Fargo Homes Mtg Inc
Bought by
Hud
Purchase Details
Closed on
Aug 8, 1996
Sold by
Reliance Homes Inc
Bought by
Davis Wallace T and Davis Erin
Home Financials for this Owner
Home Financials are based on the most recent Mortgage that was taken out on this home.
Original Mortgage
$135,992
Interest Rate
8.33%
Mortgage Type
FHA
Create a Home Valuation Report for This Property
The Home Valuation Report is an in-depth analysis detailing your home's value as well as a comparison with similar homes in the area
Home Values in the Area
Average Home Value in this Area
Purchase History
| Date | Buyer | Sale Price | Title Company |
|---|---|---|---|
| Richardson Stephen A | -- | Equity Title | |
| Doane Marcus L | -- | First American | |
| Hud | -- | Backman Stewart Title Servic | |
| Wells Fargo Home Mtg Inc | $147,529 | Backman Stewart Title Servic | |
| Davis Wallace T | -- | -- | |
| Reliance Homes Inc | -- | -- |
Source: Public Records
Mortgage History
| Date | Status | Borrower | Loan Amount |
|---|---|---|---|
| Open | Richardson Stephen A | $124,000 | |
| Previous Owner | Davis Wallace T | $135,992 | |
| Closed | Richardson Stephen A | $31,000 |
Source: Public Records
Tax History
| Year | Tax Paid | Tax Assessment Tax Assessment Total Assessment is a certain percentage of the fair market value that is determined by local assessors to be the total taxable value of land and additions on the property. | Land | Improvement |
|---|---|---|---|---|
| 2025 | $2,620 | $509,000 | $167,000 | $342,000 |
| 2024 | $2,620 | $504,100 | $160,600 | $343,500 |
| 2023 | $2,439 | $442,300 | $154,400 | $287,900 |
| 2022 | $2,519 | $449,400 | $151,400 | $298,000 |
| 2021 | $2,232 | $362,500 | $116,500 | $246,000 |
| 2020 | $2,109 | $321,400 | $107,100 | $214,300 |
| 2019 | $2,058 | $307,500 | $101,100 | $206,400 |
| 2016 | $1,636 | $226,800 | $106,100 | $120,700 |
Source: Public Records
Map
Nearby Homes
- 6831 S Fox Ridge Way
- 7125 S Case Mountain Cove
- 5430 W 7000 S
- 6873 S Red Elm Cir
- 7146 W Owens View Way Unit 204
- 6853 Mullien Dr
- 7335 S Quartz Hill Dr
- 4983 Shooting Star Ave
- 6758 S Blue Flower Ct
- 5281 Saguaro Dr
- 6739 Blue Flower Ct
- 4822 W 7000 S
- 4930 W Shooting Star Ave
- 4785 Arno Ct
- 4752 W Italian Ct
- 4752 W Mona Ln
- 6641 S Coleus Ct
- 4728 W Mona Ln
- 4792 W Pescara Ct
- 6813 S Etruscan Way
- 5155 Devonna Rd
- 5155 W Devonna Rd
- 7057 S Devonna Rd
- 7057 Devonna Rd
- 7038 Devonna Rd
- 7038 S Devonna Rd
- 5168 Devonna Rd
- 7052 Devonna Rd
- 5141 W Devonna Rd
- 5141 Devonna Rd
- 5154 Devonna Rd
- 5154 W Devonna Rd
- 5152 Wheatcrest Cir
- 5182 Devonna Rd
- 7026 Devonna Rd
- 7026 S Devonna Rd
- 7064 Devonna Rd
- 7075 S Devonna Rd
- 7075 Devonna Rd
- 5142 Devonna Rd
Your Personal Tour Guide
Ask me questions while you tour the home.