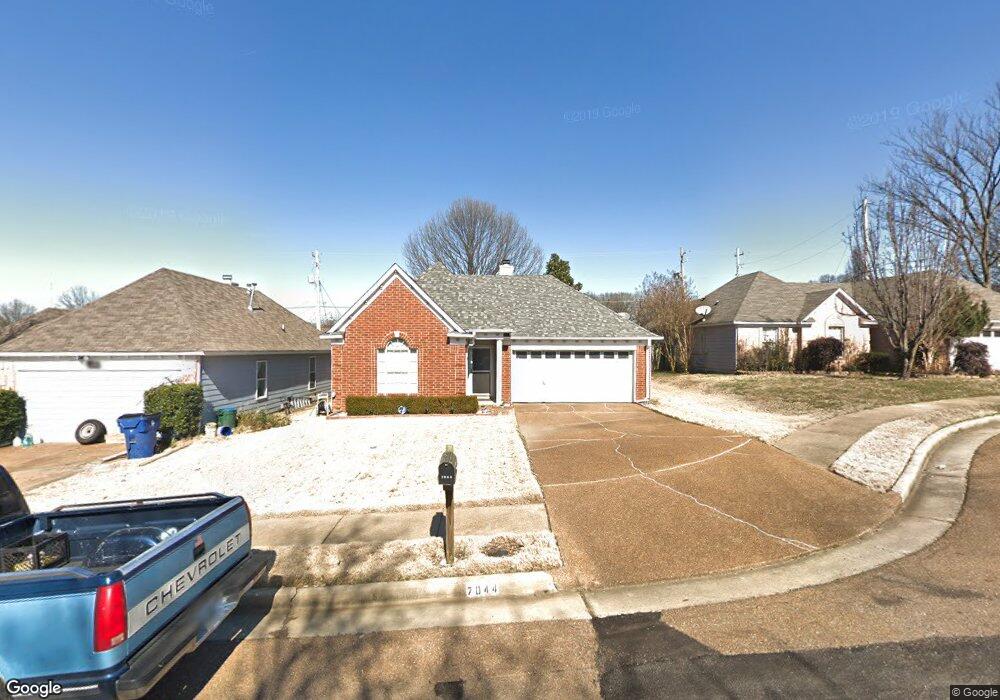
7044 Presmond Rd Cordova, TN 38018
Cordova NeighborhoodEstimated Value: $213,679 - $221,000
3
Beds
2
Baths
1,272
Sq Ft
$170/Sq Ft
Est. Value
About This Home
This home is located at 7044 Presmond Rd, Cordova, TN 38018 and is currently estimated at $216,170, approximately $169 per square foot. 7044 Presmond Rd is a home located in Shelby County with nearby schools including Dexter Elementary School, Dexter Middle School, and Cordova High School.
Ownership History
Date
Name
Owned For
Owner Type
Purchase Details
Closed on
Jul 13, 2006
Sold by
Welch Greg
Bought by
Dent William R
Current Estimated Value
Home Financials for this Owner
Home Financials are based on the most recent Mortgage that was taken out on this home.
Original Mortgage
$107,691
Outstanding Balance
$62,868
Interest Rate
6.54%
Mortgage Type
FHA
Estimated Equity
$153,302
Purchase Details
Closed on
Mar 22, 2000
Sold by
Cox Robert D and Cox M
Bought by
Welch Greg
Home Financials for this Owner
Home Financials are based on the most recent Mortgage that was taken out on this home.
Original Mortgage
$83,200
Interest Rate
8.34%
Purchase Details
Closed on
Oct 11, 1996
Sold by
Bowden Building Corp
Bought by
Cox Robert D and Cox David M
Home Financials for this Owner
Home Financials are based on the most recent Mortgage that was taken out on this home.
Original Mortgage
$89,454
Interest Rate
8.32%
Mortgage Type
FHA
Create a Home Valuation Report for This Property
The Home Valuation Report is an in-depth analysis detailing your home's value as well as a comparison with similar homes in the area
Home Values in the Area
Average Home Value in this Area
Purchase History
| Date | Buyer | Sale Price | Title Company |
|---|---|---|---|
| Dent William R | $117,900 | Stewart Title Of Memphis Inc | |
| Welch Greg | $104,000 | Stewart Title Company | |
| Welch Greg | $104,000 | Stewart Title Company | |
| Cox Robert D | $89,400 | Southern Escrow Title Compan | |
| Cox Robert D | $89,400 | Southern Escrow Title Compan |
Source: Public Records
Mortgage History
| Date | Status | Borrower | Loan Amount |
|---|---|---|---|
| Open | Dent William R | $107,691 | |
| Previous Owner | Welch Greg | $83,200 | |
| Previous Owner | Cox Robert D | $89,454 |
Source: Public Records
Tax History Compared to Growth
Tax History
| Year | Tax Paid | Tax Assessment Tax Assessment Total Assessment is a certain percentage of the fair market value that is determined by local assessors to be the total taxable value of land and additions on the property. | Land | Improvement |
|---|---|---|---|---|
| 2025 | $1,342 | $52,500 | $8,750 | $43,750 |
| 2024 | $1,342 | $39,600 | $6,875 | $32,725 |
| 2023 | $1,342 | $39,600 | $6,875 | $32,725 |
| 2022 | $1,342 | $39,600 | $6,875 | $32,725 |
| 2021 | $1,366 | $39,600 | $6,875 | $32,725 |
| 2020 | $1,051 | $25,950 | $6,875 | $19,075 |
| 2019 | $1,051 | $25,950 | $6,875 | $19,075 |
| 2018 | $1,051 | $25,950 | $6,875 | $19,075 |
| 2017 | $1,067 | $25,950 | $6,875 | $19,075 |
| 2016 | $1,072 | $24,525 | $0 | $0 |
| 2014 | $1,072 | $24,525 | $0 | $0 |
Source: Public Records
Map
Nearby Homes
- 7194 Charlton Way
- 6884 Wrigley Dr
- 6880 Wrigley Dr
- 6890 Century Oaks Dr
- 1382 Exbury Dr
- 6840 Kamali Ave
- 7035 S Estacada Way
- 6916 Lagrange Pines Rd
- 6774 Whitten Pine Dr
- 6838 Lagrange Cir N
- 7247 Winterbrook Ln
- 1089 Links View Ln W
- 7303 Winterbrook Ln
- 7468 Links View Ln S
- 7494 Links View Ln S
- 7412 Lost Trail Dr
- 7404 Appling Rain Dr
- 7426 Lost Trail Dr
- 7420 Dal Whinnie Trail
- 7410 Appling Rain Dr
- 7038 Presmond Rd
- 7050 Presmond Rd
- 7034 Presmond Rd
- 7072 Presmond Rd
- 7045 Brady Hill Dr
- 7051 Brady Hill Dr
- 7039 Brady Hill Dr
- 7030 Presmond Rd
- 7057 Brady Hill Dr
- 7039 Presmond Rd
- 7045 Presmond Rd
- 7035 Presmond Rd
- 7033 Brady Hill Dr
- 7051 Presmond Rd
- 7080 Presmond Rd
- 7063 Brady Hill Dr
- 7029 Presmond Rd
- 1172 Jessica Lauren Dr
- 7073 Presmond Rd
- 1186 Jessica Lauren Dr