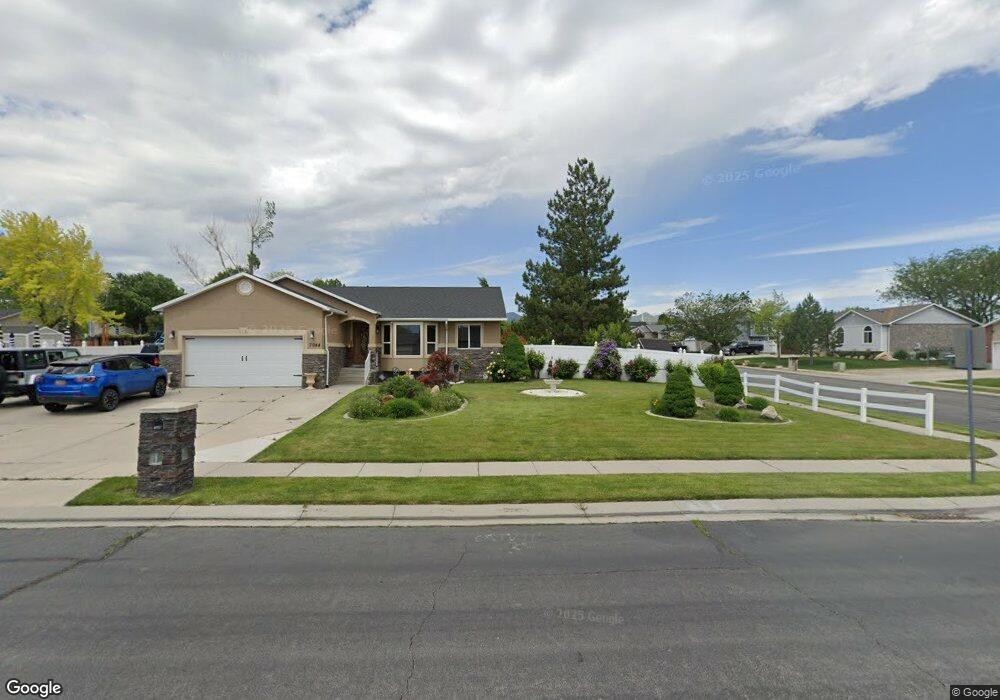
7044 S Breeze Hill Rd West Jordan, UT 84081
Shadow Mountain NeighborhoodEstimated Value: $556,000 - $618,000
5
Beds
2
Baths
2,254
Sq Ft
$254/Sq Ft
Est. Value
About This Home
This home is located at 7044 S Breeze Hill Rd, West Jordan, UT 84081 and is currently estimated at $573,029, approximately $254 per square foot. 7044 S Breeze Hill Rd is a home located in Salt Lake County with nearby schools including Mountain Shadows School, West Hills Middle School, and Copper Hills High School.
Ownership History
Date
Name
Owned For
Owner Type
Purchase Details
Closed on
Jan 22, 2003
Sold by
Loya Cesar
Bought by
Loya Cesar and Loya Julieta
Current Estimated Value
Purchase Details
Closed on
Apr 18, 2001
Sold by
Hud
Bought by
Loya Cesar
Home Financials for this Owner
Home Financials are based on the most recent Mortgage that was taken out on this home.
Original Mortgage
$148,190
Outstanding Balance
$54,466
Interest Rate
6.98%
Mortgage Type
FHA
Estimated Equity
$518,563
Purchase Details
Closed on
Dec 8, 2000
Sold by
Chase Manhattan Mtg Corp
Bought by
Hud
Purchase Details
Closed on
Dec 7, 2000
Sold by
Swanger Scott T and Swanger Stacy L
Bought by
Chase Manhattan Mtg Corp
Purchase Details
Closed on
Aug 12, 1997
Sold by
Reliance Homes Inc
Bought by
Swanger Scott T and Swanger Stacy L
Home Financials for this Owner
Home Financials are based on the most recent Mortgage that was taken out on this home.
Original Mortgage
$129,867
Interest Rate
7.61%
Mortgage Type
FHA
Create a Home Valuation Report for This Property
The Home Valuation Report is an in-depth analysis detailing your home's value as well as a comparison with similar homes in the area
Home Values in the Area
Average Home Value in this Area
Purchase History
| Date | Buyer | Sale Price | Title Company |
|---|---|---|---|
| Loya Cesar | -- | Title West | |
| Loya Cesar | -- | First American Title Insuran | |
| Hud | -- | Backman Stewart Title Servic | |
| Chase Manhattan Mtg Corp | $146,269 | Backman Stewart Title Servic | |
| Swanger Scott T | -- | -- | |
| Reliance Homes Inc | -- | -- |
Source: Public Records
Mortgage History
| Date | Status | Borrower | Loan Amount |
|---|---|---|---|
| Open | Loya Cesar | $148,190 | |
| Previous Owner | Swanger Scott T | $129,867 |
Source: Public Records
Tax History Compared to Growth
Tax History
| Year | Tax Paid | Tax Assessment Tax Assessment Total Assessment is a certain percentage of the fair market value that is determined by local assessors to be the total taxable value of land and additions on the property. | Land | Improvement |
|---|---|---|---|---|
| 2025 | $2,736 | $531,400 | $167,000 | $364,400 |
| 2024 | $2,736 | $526,500 | $160,600 | $365,900 |
| 2023 | $2,736 | $444,500 | $154,400 | $290,100 |
| 2022 | $2,525 | $450,500 | $151,400 | $299,100 |
| 2021 | $2,235 | $363,000 | $116,500 | $246,500 |
| 2020 | $2,108 | $321,200 | $107,100 | $214,100 |
| 2019 | $2,059 | $307,700 | $101,100 | $206,600 |
| 2018 | $1,887 | $279,700 | $101,100 | $178,600 |
| 2017 | $1,833 | $270,500 | $101,100 | $169,400 |
| 2016 | $1,627 | $225,600 | $106,100 | $119,500 |
| 2015 | $1,736 | $234,700 | $113,700 | $121,000 |
| 2014 | $1,694 | $225,500 | $110,100 | $115,400 |
Source: Public Records
Map
Nearby Homes
- 4888 Ticklegrass Rd
- 6928 Beargrass Rd
- 7232 W Terraine Rd
- 7238 W Terraine Rd
- 7246 W Terraine Rd
- 4891 Calyx Cir
- 5151 Case Mountain Rd
- 7071 S Kristilyn Ln
- 5208 W Case Mountain Rd
- 7138 S Brittany Town Dr
- 6880 S Survey Peak Ln
- 6884 S Survey Peak Ln
- 6888 S Survey Peak Ln
- 4983 Shooting Star Ave
- 7173 S Kristilyn Ln
- 4763 W Arno Way
- 4785 Foggio Ct
- 6900 S Florentine Way
- 6983 Florentine Way
- 7093 S Greensand Dr
- 7044 Breeze Hill Rd
- 7043 Aerie Hill Dr
- 7043 S Aerie Hill Dr
- 7058 Breeze Hill Rd
- 5006 Robin Hill Rd
- 7057 S Aerie Hill Dr
- 7057 Aerie Hill Dr
- 4977 Robin Hill Rd
- 5018 Robin Hill Rd
- 7041 S Breeze Hill Rd
- 7059 S Breeze Hill Rd
- 7086 S Aerie Hill Dr
- 7059 Breeze Hill Rd
- 7072 Breeze Hill Rd
- 5028 Robin Hill Rd
- 4978 Robin Hill Rd
- 4978 W 7030 S
- 5028 W Robin Hill Rd
- 7071 S Aerie Hill Dr
- 7071 Aerie Hill Dr