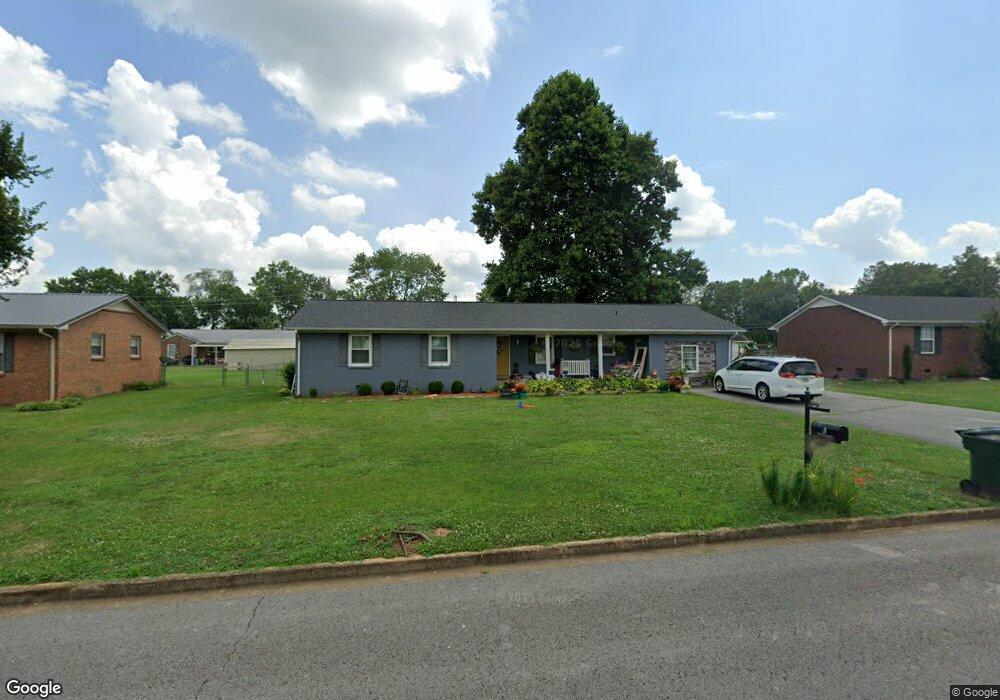
705 3rd St Lawrenceburg, TN 38464
Estimated Value: $258,940 - $297,000
3
Beds
2
Baths
2,020
Sq Ft
$139/Sq Ft
Est. Value
About This Home
This home is located at 705 3rd St, Lawrenceburg, TN 38464 and is currently estimated at $281,235, approximately $139 per square foot. 705 3rd St is a home located in Lawrence County with nearby schools including Ingram Sowell Elementary School, Lawrenceburg Public Elementary School, and David Crockett Elementary School.
Ownership History
Date
Name
Owned For
Owner Type
Purchase Details
Closed on
May 11, 2017
Sold by
Hill Steve
Bought by
Bryce Jared P and Bryce April L
Current Estimated Value
Purchase Details
Closed on
Dec 16, 2016
Sold by
Arnold Linda
Bought by
Hill Steve
Purchase Details
Closed on
Mar 22, 2010
Sold by
Arnold J W
Bought by
Arnold Linda
Purchase Details
Closed on
Apr 29, 1986
Purchase Details
Closed on
Jan 1, 1980
Create a Home Valuation Report for This Property
The Home Valuation Report is an in-depth analysis detailing your home's value as well as a comparison with similar homes in the area
Home Values in the Area
Average Home Value in this Area
Purchase History
| Date | Buyer | Sale Price | Title Company |
|---|---|---|---|
| Bryce Jared P | $136,900 | -- | |
| Hill Steve | $62,000 | -- | |
| Arnold Linda | $12,405 | -- | |
| -- | $59,000 | -- | |
| Wife Arnold J | -- | -- | |
| -- | $50,000 | -- |
Source: Public Records
Tax History Compared to Growth
Tax History
| Year | Tax Paid | Tax Assessment Tax Assessment Total Assessment is a certain percentage of the fair market value that is determined by local assessors to be the total taxable value of land and additions on the property. | Land | Improvement |
|---|---|---|---|---|
| 2025 | $1,483 | $47,700 | $0 | $0 |
| 2024 | $1,483 | $47,700 | $3,750 | $43,950 |
| 2023 | $1,483 | $47,700 | $3,750 | $43,950 |
| 2022 | $1,483 | $47,700 | $3,750 | $43,950 |
| 2021 | $1,407 | $32,000 | $2,500 | $29,500 |
| 2020 | $1,407 | $32,000 | $2,500 | $29,500 |
| 2019 | $1,407 | $32,000 | $2,500 | $29,500 |
| 2018 | $1,407 | $32,000 | $2,500 | $29,500 |
| 2017 | $1,110 | $25,250 | $2,500 | $22,750 |
| 2016 | $1,110 | $25,250 | $2,500 | $22,750 |
| 2015 | $1,051 | $25,250 | $2,500 | $22,750 |
| 2014 | $942 | $22,625 | $2,500 | $20,125 |
Source: Public Records
Map
Nearby Homes