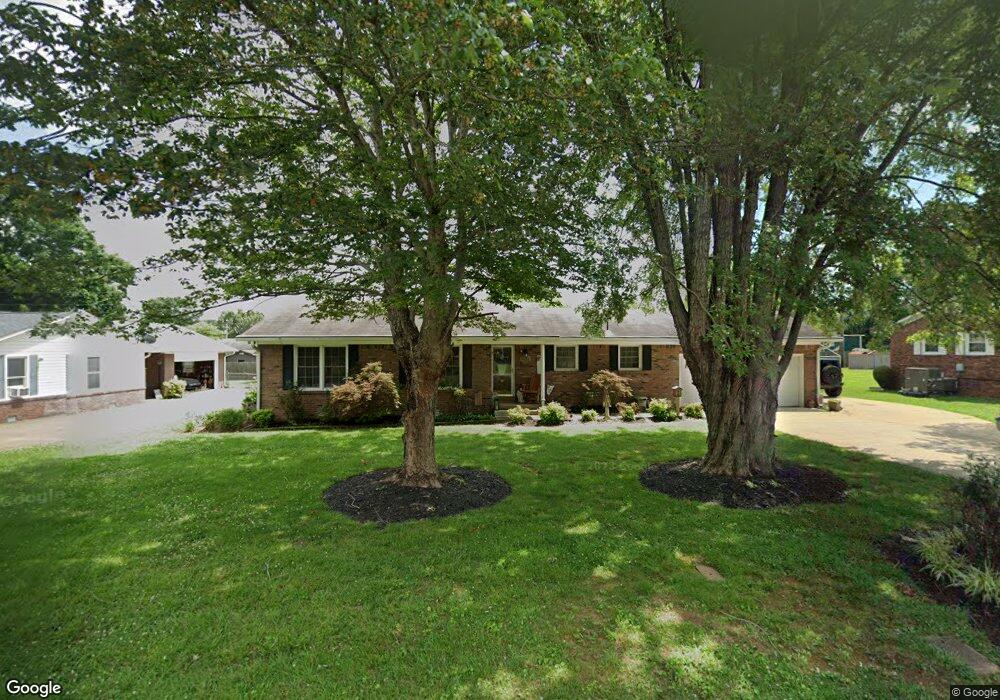
705 4th St Lawrenceburg, TN 38464
Estimated Value: $224,000 - $300,000
--
Bed
3
Baths
2,102
Sq Ft
$121/Sq Ft
Est. Value
About This Home
This home is located at 705 4th St, Lawrenceburg, TN 38464 and is currently estimated at $254,056, approximately $120 per square foot. 705 4th St is a home located in Lawrence County with nearby schools including Ingram Sowell Elementary School, Lawrenceburg Public Elementary School, and David Crockett Elementary School.
Ownership History
Date
Name
Owned For
Owner Type
Purchase Details
Closed on
May 22, 2013
Bought by
Hagan Melinda Ann
Current Estimated Value
Purchase Details
Closed on
Aug 8, 1992
Bought by
Baker Calvin H and Baker Nell
Purchase Details
Closed on
Feb 20, 1990
Bought by
Baker Calvin H and Baker Nell
Purchase Details
Closed on
Mar 28, 1989
Bought by
Skaggs Carroll H
Purchase Details
Closed on
Feb 14, 1989
Bought by
Moore William H and Moore Patsy
Purchase Details
Closed on
Nov 18, 1986
Purchase Details
Closed on
Aug 23, 1985
Bought by
Moore William H
Create a Home Valuation Report for This Property
The Home Valuation Report is an in-depth analysis detailing your home's value as well as a comparison with similar homes in the area
Home Values in the Area
Average Home Value in this Area
Purchase History
| Date | Buyer | Sale Price | Title Company |
|---|---|---|---|
| Hagan Melinda Ann | -- | -- | |
| Hagan Melinda Ann | -- | -- | |
| Baker Calvin H | $72,000 | -- | |
| Baker Calvin H | $64,000 | -- | |
| Skaggs Carroll H | $55,000 | -- | |
| Moore William H | -- | -- | |
| -- | $40,200 | -- | |
| Moore William H | -- | -- |
Source: Public Records
Tax History Compared to Growth
Tax History
| Year | Tax Paid | Tax Assessment Tax Assessment Total Assessment is a certain percentage of the fair market value that is determined by local assessors to be the total taxable value of land and additions on the property. | Land | Improvement |
|---|---|---|---|---|
| 2025 | $1,565 | $50,350 | $0 | $0 |
| 2024 | $1,565 | $50,350 | $3,750 | $46,600 |
| 2023 | $1,565 | $50,350 | $3,750 | $46,600 |
| 2022 | $1,565 | $50,350 | $3,750 | $46,600 |
| 2021 | $1,416 | $32,200 | $2,500 | $29,700 |
| 2020 | $1,416 | $32,200 | $2,500 | $29,700 |
| 2019 | $1,416 | $32,200 | $2,500 | $29,700 |
| 2018 | $1,416 | $32,200 | $2,500 | $29,700 |
| 2017 | $1,416 | $32,200 | $2,500 | $29,700 |
| 2016 | $1,416 | $32,200 | $2,500 | $29,700 |
| 2015 | $1,340 | $32,200 | $2,500 | $29,700 |
| 2014 | $1,203 | $28,900 | $2,500 | $26,400 |
Source: Public Records
Map
Nearby Homes