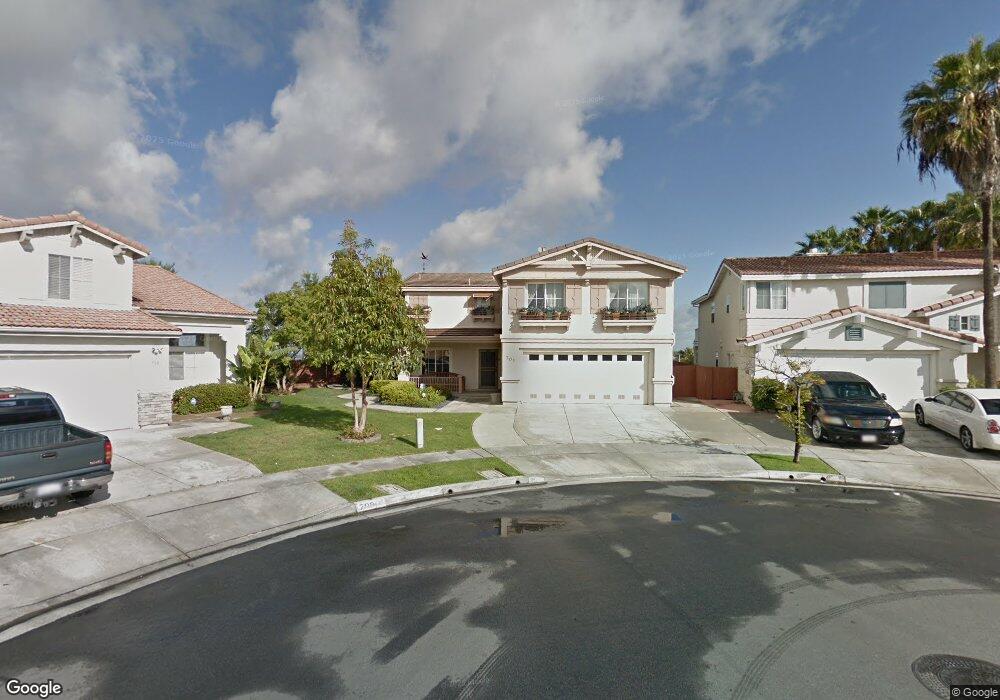
705 Bardsley Ct San Diego, CA 92154
Ocean View Hills NeighborhoodEstimated Value: $838,692 - $953,000
3
Beds
3
Baths
1,606
Sq Ft
$574/Sq Ft
Est. Value
About This Home
This home is located at 705 Bardsley Ct, San Diego, CA 92154 and is currently estimated at $921,173, approximately $573 per square foot. 705 Bardsley Ct is a home located in San Diego County with nearby schools including Ocean View Hills, Vista Del Mar, and San Ysidro Middle School.
Ownership History
Date
Name
Owned For
Owner Type
Purchase Details
Closed on
Jul 13, 2007
Sold by
Margain Angel Fernandez
Bought by
Margain Angel Fernandez
Current Estimated Value
Purchase Details
Closed on
Apr 21, 2003
Sold by
Scherneck William T and Mchale Patrick J
Bought by
Fernandez Angel
Home Financials for this Owner
Home Financials are based on the most recent Mortgage that was taken out on this home.
Original Mortgage
$343,200
Outstanding Balance
$147,436
Interest Rate
5.75%
Mortgage Type
Stand Alone First
Estimated Equity
$773,737
Purchase Details
Closed on
May 8, 2000
Sold by
Pardee Construction Company
Bought by
Scherneck William T and Mchale Patrick J
Home Financials for this Owner
Home Financials are based on the most recent Mortgage that was taken out on this home.
Original Mortgage
$245,000
Interest Rate
8%
Purchase Details
Closed on
May 5, 2000
Sold by
Parone Inc
Bought by
Scherneck William T and Mchale Patrick J
Home Financials for this Owner
Home Financials are based on the most recent Mortgage that was taken out on this home.
Original Mortgage
$245,000
Interest Rate
8%
Create a Home Valuation Report for This Property
The Home Valuation Report is an in-depth analysis detailing your home's value as well as a comparison with similar homes in the area
Home Values in the Area
Average Home Value in this Area
Purchase History
| Date | Buyer | Sale Price | Title Company |
|---|---|---|---|
| Margain Angel Fernandez | -- | None Available | |
| Fernandez Angel | $444,000 | First American Title Co | |
| Scherneck William T | -- | Chicago Title Co | |
| Scherneck William T | $258,000 | Chicago Title Co |
Source: Public Records
Mortgage History
| Date | Status | Borrower | Loan Amount |
|---|---|---|---|
| Open | Fernandez Angel | $343,200 | |
| Previous Owner | Scherneck William T | $245,000 |
Source: Public Records
Tax History Compared to Growth
Tax History
| Year | Tax Paid | Tax Assessment Tax Assessment Total Assessment is a certain percentage of the fair market value that is determined by local assessors to be the total taxable value of land and additions on the property. | Land | Improvement |
|---|---|---|---|---|
| 2025 | $8,698 | $643,008 | $279,566 | $363,442 |
| 2024 | $8,698 | $630,401 | $274,085 | $356,316 |
| 2023 | $8,529 | $618,041 | $268,711 | $349,330 |
| 2022 | $8,569 | $605,924 | $263,443 | $342,481 |
| 2021 | $8,589 | $594,044 | $258,278 | $335,766 |
| 2020 | $8,229 | $570,000 | $232,000 | $338,000 |
| 2019 | $7,484 | $525,000 | $214,000 | $311,000 |
| 2018 | $7,182 | $500,000 | $204,000 | $296,000 |
| 2017 | $6,595 | $450,000 | $184,000 | $266,000 |
| 2016 | $6,375 | $440,000 | $180,000 | $260,000 |
| 2015 | $5,928 | $400,000 | $164,000 | $236,000 |
| 2014 | $5,351 | $350,000 | $144,000 | $206,000 |
Source: Public Records
Map
Nearby Homes
- 1166 Sea Bird Way Unit 3D
- 4821 Sea Water Ln
- 5118 Mariner Dr
- 5080 Sea Reef Place
- 4250 Lemonseed Dr
- 4205 Rene Dr
- 782 Anchor Cove
- 751 Anchor Cove
- 4325 Darwin Way
- 5192 Emerald Cove
- 843 Compass Way
- 321 Rancho Dr Unit 45
- 1378 Starry Way
- 1568 Coporate Center Drive & Otay Mesa Rd Unit 12,13,14
- 0 Future Airway Rd Unit Tr 1267 Lot 27
- 1185 Ransom St
- 1250 Sand Drift Point
- 1721 Melrose Ave Unit 16
- 1737 Melrose Ave Unit 63
- 1721 Melrose Ave Unit 15
- 717 Bardsley Ct
- 708 Bardsley Ct
- 729 Bardsley Ct
- 720 Bardsley Ct
- 741 Bardsley Ct
- 732 Bardsley Ct
- 4768 Camberley Ct
- 4720 Camberley Ct
- 4774 Camberley Ct
- 4765 Camberley Ct
- 4747 Camberley Ct
- 4780 Camberley Ct Unit 1
- 4741 Camberley Ct
- 4735 Camberley Ct
- 4773 Camberley Ct
- 4729 Camberley Ct
- 590 Offshore Point Unit 1B
- 4786 Camberley Ct
- 4707 Red Sails Way
- 4711 Red Sails Way